


Signalement de photo
Merci ! Votre signalement est envoyé !
Quel est le nombre d'habitants à Montpouillan ? Dans quel département et dans quelle région se situe la ville ? Quelle est sa superficie ?
Quels sont les chiffres de la délinquance ?
Découvrez sur cette page toutes les informations essentielles sur la population, la sécurité, les services et l'immobilier à Montpouillan.
NOUVEAU : Rues sales, dépôts sauvages, dégradations urbaines. Faites votre signalement anonyme, nous nous chargeons de prévenir les autorités compétentes.
| Nombre d'habitants | 827 | Classement |
| Age moyen | 41 ans | Classement |
| Pop active | 49.6% | Classement |
| Taux chômage | 3% | Classement |
| Pop densité | 69 h/km² | Classement |
| Revenu moyen | 22 030 €/an | Classement |
| Agressions physiques / sexuelles | 0 |
| Cambriolages | 0 |
| Vols / dégradations | 0 |
| Stupéfiants | 0 |
Achat / Vente / Location Votre agence immobilière à Montpouillan
| Prix moyen | 135 113 € | Prix moyen au m² | 1 255 € |
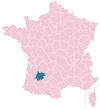
Carte de la ville de Montpouillan


NOUVEAU : Décharges sauvages, détritus, objets abandonnés, graffitis, nids-de-poule : Déclarer un incident à Montpouillan


 Marine LE PEN
 Jean-Luc MÉLENCHON
 Emmanuel MACRON
 Jean LASSALLE
 Éric ZEMMOUR
 Fabien ROUSSEL
 Valérie PÉCRESSE
 Yannick JADOT
 Nicolas DUPONT-AIGNAN
 Anne HIDALGO
 Philippe POUTOU
 Nathalie ARTHAUDEmmanuel MACRONMarine LE PEN
| Ville | Habitants | Superficie | Pop densité | Pop active | Taux chômage | Revenu moyen | Prix immobilier | Note globale |
|---|---|---|---|---|---|---|---|---|
| Statistiques Gaujac | 242 | 7 km² | 35 h/km² | 43% | 4.1% | 19 670 €/an | 800 €/m² | - |
| Statistiques Marcellus | 865 | 12 km² | 72 h/km² | 46% | 5.4% | 21 840 €/an | 1 313 €/m² | - |
| Statistiques Marmande | 17 239 | 45 km² | 383 h/km² | 41.3% | 7.3% | 19 840 €/an | 1 353 €/m² | 3.4 |
| Statistiques Couthures-sur-Garonne | 368 | 7 km² | 53 h/km² | 44.3% | 8.2% | 18 850 €/an | 954 €/m² | - |
| Statistiques Samazan | 875 | 17 km² | 51 h/km² | 43.7% | 4.6% | 22 470 €/an | 1 251 €/m² | - |
| Statistiques Sainte-Bazeille | 3 173 | 21 km² | 151 h/km² | 42.4% | 5.5% | 21 140 €/an | 1 412 €/m² | - |
| Statistiques Fourques-sur-Garonne | 1 322 | 14 km² | 94 h/km² | 47% | 5.1% | 24 080 €/an | 1 466 €/m² | - |
| Statistiques Beaupuy | 1 648 | 8 km² | 206 h/km² | 46.1% | 3.5% | 23 380 €/an | 1 578 €/m² | - |
| Statistiques Jusix | 96 | 8 km² | 12 h/km² | 47.9% | 7.3% | 19 490 €/an | 809 €/m² | - |
| Statistiques Lagupie | 692 | 9 km² | 77 h/km² | 45.7% | 5.2% | 24 110 €/an | 1 597 €/m² | 3.8 |
| Statistiques Saint-Martin-Petit | 624 | 6 km² | 104 h/km² | 48.9% | 4.5% | 21 950 €/an | 1 390 €/m² | - |
| Statistiques Caumont-sur-Garonne | 809 | 12 km² | 67 h/km² | 48.3% | 5.2% | 20 750 €/an | 1 124 €/m² | 2.9 |
| Statistiques Cocumont | 1 088 | 25 km² | 44 h/km² | 43.3% | 6.4% | 20 580 €/an | 965 €/m² | - |
| Statistiques Meilhan-sur-Garonne | 1 344 | 29 km² | 46 h/km² | 41.6% | 5.5% | 20 060 €/an | 1 174 €/m² | 2.8 |
| Statistiques Castelnau-sur-Gupie | 909 | 15 km² | 61 h/km² | 49.1% | 2.9% | 25 230 €/an | 1 531 €/m² | - |