


Signalement de photo
Merci ! Votre signalement est envoyé !
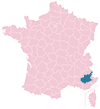
Quel est le nombre d'habitants à Montfuron ? Dans quel département et dans quelle région se situe la ville ? Quelle est sa superficie ?
Quels sont les chiffres de la délinquance ?
Découvrez sur cette page toutes les informations essentielles sur la population, la sécurité, les services et l'immobilier à Montfuron.
NOUVEAU : Rues sales, dépôts sauvages, dégradations urbaines. Faites votre signalement anonyme, nous nous chargeons de prévenir les autorités compétentes.
| Nombre d'habitants | 225 | Classement |
| Age moyen | 43 ans | Classement |
| Pop active | 46.7% | Classement |
| Taux chômage | 6.7% | Classement |
| Pop densité | 12 h/km² | Classement |
| Revenu moyen | 24 830 €/an | Classement |
| Agressions physiques / sexuelles | 0 |
| Cambriolages | 0 |
| Vols / dégradations | 0 |
| Stupéfiants | 0 |
Achat / Vente / Location Votre agence immobilière à Montfuron
| Prix moyen | 128 115 € | Prix moyen au m² | 1 025 € |
Carte de la ville de Montfuron

Commerce |
|
|---|---|
|
Hypermarché (7km) Manosque |
|
|
Supermarché (7km) Manosque |
|
|
Boulangerie (4km) Pierrevert |
|
|
Boucherie (4km) Pierrevert |
|
|
Station-service (7km) Manosque |
|
|
Banque (4km) Pierrevert |
|
|
La poste (4km) Pierrevert |
|
|
Coiffeur (4km) Villemus |
|
|
Vétérinaire (7km) Manosque |
|
| Restaurant | 1 |
Santé |
|
|---|---|
|
Médecin (4km) Pierrevert |
|
|
Dentiste (4km) Pierrevert |
|
|
Pharmacie (4km) Pierrevert |
|


NOUVEAU : Décharges sauvages, détritus, objets abandonnés, graffitis, nids-de-poule : Déclarer un incident à Montfuron


 Emmanuel MACRON
 Jean-Luc MÉLENCHON
 Marine LE PEN
 Jean LASSALLE
 Éric ZEMMOUR
 Yannick JADOT
 Valérie PÉCRESSE
 Fabien ROUSSEL
 Nicolas DUPONT-AIGNAN
 Nathalie ARTHAUD
 Anne HIDALGO
 Philippe POUTOUEmmanuel MACRONMarine LE PEN
| Ville | Habitants | Superficie | Pop densité | Pop active | Taux chômage | Revenu moyen | Prix immobilier | Note globale |
|---|---|---|---|---|---|---|---|---|
| Statistiques Villemus | 193 | 10 km² | 19 h/km² | 48.2% | 4.7% | 22 410 €/an | 2 134 €/m² | 3.6 |
| Statistiques Pierrevert | 3 941 | 28 km² | 141 h/km² | 43.1% | 4.2% | 27 990 €/an | 2 490 €/m² | - |
| Statistiques Montjustin | 59 | 10 km² | 6 h/km² | 49.2% | 11.9% | NC | 4 787 €/m² | - |
| Statistiques Reillanne | 1 713 | 39 km² | 44 h/km² | 42% | 4.8% | 21 480 €/an | 2 174 €/m² | 4.3 |
| Statistiques Manosque | 22 926 | 57 km² | 402 h/km² | 42.6% | 6.9% | 21 170 €/an | 2 064 €/m² | 2.8 |
| Statistiques Saint-Martin-les-Eaux | 125 | 9 km² | 14 h/km² | 51.2% | 1.6% | 21 630 €/an | 550 €/m² | - |
| Statistiques La Bastide-des-Jourdans | 1 686 | 28 km² | 60 h/km² | 46.9% | 6.9% | 22 970 €/an | 5 181 €/m² | 3.3 |
| Statistiques Sainte-Tulle | 3 489 | 17 km² | 205 h/km² | 47.1% | 8.7% | 22 180 €/an | 1 974 €/m² | 2.2 |
| Statistiques Vitrolles-en-Lubéron | 180 | 16 km² | 11 h/km² | 38.3% | 3.3% | 24 720 €/an | 3 824 €/m² | - |
| Statistiques Corbières-en-Provence | 1 254 | 19 km² | 66 h/km² | 47.2% | 5.6% | 24 550 €/an | 2 524 €/m² | 1.0 |
| Statistiques Saint-Michel-l'Observatoire | 1 226 | 28 km² | 44 h/km² | 46% | 5.3% | 22 620 €/an | 2 127 €/m² | - |
| Statistiques Céreste | 1 194 | 33 km² | 36 h/km² | 38.5% | 6.8% | 20 500 €/an | 2 212 €/m² | - |
| Statistiques Dauphin | 838 | 10 km² | 84 h/km² | 45.1% | 6% | 24 570 €/an | 2 638 €/m² | - |
| Statistiques Saint-Maime | 885 | 8 km² | 111 h/km² | 47.9% | 7.6% | 22 120 €/an | 1 921 €/m² | 4.0 |
| Statistiques Beaumont-de-Pertuis | 1 115 | 56 km² | 20 h/km² | 51.3% | 7.5% | 23 540 €/an | 2 602 €/m² | - |