


Signalement de photo
Merci ! Votre signalement est envoyé !
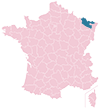
Quel est le nombre d'habitants à Manom ? Dans quel département et dans quelle région se situe la ville ? Quelle est sa superficie ?
Quels sont les chiffres de la délinquance ?
Découvrez sur cette page toutes les informations essentielles sur la population, la sécurité, les services et l'immobilier à Manom.
NOUVEAU : Rues sales, dépôts sauvages, dégradations urbaines. Faites votre signalement anonyme, nous nous chargeons de prévenir les autorités compétentes.
| Nombre d'habitants | 3 010 | Classement |
| Age moyen | 42 ans | Classement |
| Pop active | 52.8% | Classement |
| Taux chômage | 4.4% | Classement |
| Pop densité | 301 h/km² | Classement |
| Revenu moyen | 30 140 €/an | Classement |
| Agressions physiques / sexuelles | 16 |
| Cambriolages | 0 |
| Vols / dégradations | 42 |
| Stupéfiants | 0 |
Achat / Vente / Location Votre agence immobilière à Manom
| Prix moyen | 0 € | Prix moyen au m² | 0 € |
Carte de la ville de Manom

Commerce |
|
|---|---|
|
Hypermarché (1km) Thionville |
|
| Supermarché | 1 |
| Boulangerie | 6 |
| Boucherie | 1 |
| Station-service | 1 |
|
Banque (1km) Yutz |
|
|
La poste (1km) Yutz |
|
| Coiffeur | 5 |
| Vétérinaire | 1 |
| Restaurant | 9 |
Santé |
|
|---|---|
| Médecin | 2 |
| Dentiste | 6 |
| Pharmacie | 1 |
Éducation |
|
|---|---|
| Maternelle | 1 |
| Primaire | 1 |
|
Collège (1km) Yutz |
|
|
Lycée (1km) Thionville |
|


NOUVEAU : Décharges sauvages, détritus, objets abandonnés, graffitis, nids-de-poule : Déclarer un incident à Manom


 Emmanuel MACRON
 Marine LE PEN
 Jean-Luc MÉLENCHON
 Éric ZEMMOUR
 Yannick JADOT
 Valérie PÉCRESSE
 Fabien ROUSSEL
 Jean LASSALLE
 Anne HIDALGO
 Nicolas DUPONT-AIGNAN
 Philippe POUTOU
 Nathalie ARTHAUDEmmanuel MACRONMarine LE PEN
| Ville | Habitants | Superficie | Pop densité | Pop active | Taux chômage | Revenu moyen | Prix immobilier | Note globale |
|---|---|---|---|---|---|---|---|---|
| Statistiques Yutz | 17 401 | 14 km² | 1 243 h/km² | 48.8% | 6.1% | 24 410 €/an | NC | 3.8 |
| Statistiques Thionville | 42 163 | 50 km² | 843 h/km² | 47.9% | 5.8% | 24 850 €/an | NC | 3.2 |
| Statistiques Terville | 7 456 | 4 km² | 1 864 h/km² | 49.2% | 6.2% | 23 960 €/an | NC | 2.5 |
| Statistiques Illange | 1 799 | 6 km² | 300 h/km² | 46% | 4.6% | 27 560 €/an | NC | - |
| Statistiques Kuntzig | 1 362 | 5 km² | 272 h/km² | 50% | 2.9% | 29 220 €/an | NC | - |
| Statistiques Hettange-Grande | 7 765 | 16 km² | 485 h/km² | 53.1% | 4.1% | 31 880 €/an | NC | 4.0 |
| Statistiques Basse-Ham | 2 237 | 10 km² | 224 h/km² | 48.5% | 3.7% | 28 640 €/an | NC | 4.2 |
| Statistiques Stuckange | 1 396 | 4 km² | 349 h/km² | 47.6% | 2.7% | 31 400 €/an | NC | - |
| Statistiques Valmestroff | 340 | 4 km² | 85 h/km² | 50% | 4.7% | 27 860 €/an | NC | 3.8 |
| Statistiques Florange | 11 869 | 13 km² | 913 h/km² | 47.2% | 5.9% | 21 130 €/an | NC | 3.8 |
| Statistiques Distroff | 1 836 | 8 km² | 230 h/km² | 47.8% | 3% | 27 860 €/an | NC | 3.2 |
| Statistiques Elzange | 683 | 4 km² | 171 h/km² | 48.6% | 1.3% | 25 890 €/an | NC | - |
| Statistiques Cattenom | 2 606 | 26 km² | 100 h/km² | 51.8% | 5% | 28 820 €/an | NC | 4.1 |
| Statistiques Boust | 1 154 | 7 km² | 165 h/km² | 53.4% | 2.4% | 34 980 €/an | NC | 1.4 |
| Statistiques Bertrange | 2 859 | 7 km² | 408 h/km² | 47.4% | 3.6% | 30 270 €/an | NC | - |