


Signalement de photo
Merci ! Votre signalement est envoyé !
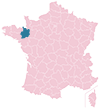
Quel est le nombre d'habitants à Lécousse ? Dans quel département et dans quelle région se situe la ville ? Quelle est sa superficie ?
Quels sont les chiffres de la délinquance ?
Découvrez sur cette page toutes les informations essentielles sur la population, la sécurité, les services et l'immobilier à Lécousse.
NOUVEAU : Rues sales, dépôts sauvages, dégradations urbaines. Faites votre signalement anonyme, nous nous chargeons de prévenir les autorités compétentes.
| Nombre d'habitants | 3 322 | Classement |
| Age moyen | 45 ans | Classement |
| Pop active | 42.5% | Classement |
| Taux chômage | 2.5% | Classement |
| Pop densité | 302 h/km² | Classement |
| Revenu moyen | 24 230 €/an | Classement |
| Agressions physiques / sexuelles | 32 |
| Cambriolages | 0 |
| Vols / dégradations | 39 |
| Stupéfiants | 0 |
Achat / Vente / Location Votre agence immobilière à Lécousse
| Prix moyen | 186 904 € | Prix moyen au m² | 1 755 € |
| Prix moyen | 64 356 € | Prix moyen au m² | 1 268 € |
Carte de la ville de Lécousse

Commerce |
|
|---|---|
| Hypermarché | 1 |
| Supermarché | 1 |
| Boulangerie | 2 |
|
Boucherie (2km) Fougères |
|
| Station-service | 1 |
| Banque | 1 |
|
La poste (2km) Fougères |
|
| Coiffeur | 4 |
| Vétérinaire | 4 |
| Restaurant | 5 |
Santé |
|
|---|---|
| Médecin | 3 |
| Dentiste | 2 |
| Pharmacie | 1 |


NOUVEAU : Décharges sauvages, détritus, objets abandonnés, graffitis, nids-de-poule : Déclarer un incident à Lécousse


 Emmanuel MACRON
 Marine LE PEN
 Jean-Luc MÉLENCHON
 Yannick JADOT
 Valérie PÉCRESSE
 Éric ZEMMOUR
 Fabien ROUSSEL
 Nicolas DUPONT-AIGNAN
 Jean LASSALLE
 Anne HIDALGO
 Philippe POUTOU
 Nathalie ARTHAUDEmmanuel MACRONMarine LE PEN
| Ville | Habitants | Superficie | Pop densité | Pop active | Taux chômage | Revenu moyen | Prix immobilier | Note globale |
|---|---|---|---|---|---|---|---|---|
| Statistiques Fougères | 20 653 | 10 km² | 2 065 h/km² | 42.7% | 6.9% | 20 620 €/an | 1 354 €/m² | 3.6 |
| Statistiques Saint-Germain-en-Coglès | 2 086 | 32 km² | 65 h/km² | 45.3% | 2.9% | 22 440 €/an | 1 310 €/m² | 4.8 |
| Statistiques Laignelet | 1 201 | 15 km² | 80 h/km² | 46% | 3% | 23 920 €/an | 1 677 €/m² | - |
| Statistiques Beaucé | 1 322 | 8 km² | 165 h/km² | 45.1% | 2.8% | 23 310 €/an | 1 411 €/m² | - |
| Statistiques Romagne | 2 440 | 27 km² | 90 h/km² | 49.3% | 2% | 23 580 €/an | 1 431 €/m² | - |
| Statistiques Javené | 2 165 | 18 km² | 120 h/km² | 48.7% | 3.1% | 23 730 €/an | 1 312 €/m² | 3.2 |
| Statistiques Landéan | 1 201 | 27 km² | 44 h/km² | 43.1% | 3.2% | 21 380 €/an | 1 301 €/m² | 4.6 |
| Statistiques Parigné | 1 315 | 21 km² | 63 h/km² | 48.9% | 4.5% | 21 780 €/an | 1 050 €/m² | - |
| Statistiques Saint-Sauveur-des-Landes | 1 551 | 19 km² | 82 h/km² | 42.8% | 2.2% | 23 150 €/an | 1 423 €/m² | - |
| Statistiques Fleurigné | 917 | 18 km² | 51 h/km² | 51.4% | 3.3% | 22 220 €/an | 1 015 €/m² | 3.4 |
| Statistiques La Chapelle-Saint-Aubert | 456 | 10 km² | 46 h/km² | 49.1% | 3.3% | 23 380 €/an | 1 302 €/m² | - |
| Statistiques La Chapelle-Janson | 1 492 | 27 km² | 55 h/km² | 45% | 3% | 21 660 €/an | 1 236 €/m² | - |
| Statistiques Billé | 1 067 | 17 km² | 63 h/km² | 46.8% | 2.6% | 22 790 €/an | 1 589 €/m² | - |
| Statistiques La Selle-en-Luitré | 615 | 7 km² | 88 h/km² | 48.8% | 3.3% | 22 620 €/an | 1 012 €/m² | - |
| Statistiques Saint-Hilaire-des-Landes | 1 032 | 18 km² | 57 h/km² | 48.8% | 4.2% | 22 230 €/an | 1 211 €/m² | - |