


Signalement de photo
Merci ! Votre signalement est envoyé !
Quel est le nombre d'habitants à Kruth ? Dans quel département et dans quelle région se situe la ville ? Quelle est sa superficie ?
Quels sont les chiffres de la délinquance ?
Découvrez sur cette page toutes les informations essentielles sur la population, la sécurité, les services et l'immobilier à Kruth.
NOUVEAU : Rues sales, dépôts sauvages, dégradations urbaines. Faites votre signalement anonyme, nous nous chargeons de prévenir les autorités compétentes.
| Nombre d'habitants | 910 | Classement |
| Age moyen | 47 ans | Classement |
| Pop active | 46.4% | Classement |
| Taux chômage | 5.6% | Classement |
| Pop densité | 41 h/km² | Classement |
| Revenu moyen | 23 690 €/an | Classement |
| Agressions physiques / sexuelles | 0 |
| Cambriolages | 0 |
| Vols / dégradations | 0 |
| Stupéfiants | 0 |
Achat / Vente / Location Votre agence immobilière à Kruth
| Prix moyen | 0 € | Prix moyen au m² | 0 € |
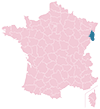
Carte de la ville de Kruth

Commerce |
|
|---|---|
|
Hypermarché (14km) Bitschwiller-lès-Thann |
|
|
Supermarché (7km) Saint-Amarin |
|
|
Boulangerie (2km) Oderen |
|
|
Boucherie (7km) Saint-Amarin |
|
|
Station-service (4km) Fellering |
|
|
Banque (4km) Fellering |
|
|
La poste (4km) Fellering |
|
|
Coiffeur (2km) Oderen |
|
|
Vétérinaire (9km) Moosch |
|
| Restaurant | 3 |
Éducation |
|
|---|---|
| Maternelle | 1 |
| Primaire | 1 |
|
Collège (7km) Saint-Amarin |
|
|
Lycée (16km) Thann |
|


NOUVEAU : Décharges sauvages, détritus, objets abandonnés, graffitis, nids-de-poule : Déclarer un incident à Kruth


 Marine LE PEN
 Emmanuel MACRON
 Jean-Luc MÉLENCHON
 Éric ZEMMOUR
 Jean LASSALLE
 Yannick JADOT
 Nicolas DUPONT-AIGNAN
 Valérie PÉCRESSE
 Anne HIDALGO
 Nathalie ARTHAUD
 Fabien ROUSSEL
 Philippe POUTOUEmmanuel MACRONMarine LE PEN
| Ville | Habitants | Superficie | Pop densité | Pop active | Taux chômage | Revenu moyen | Prix immobilier | Note globale |
|---|---|---|---|---|---|---|---|---|
| Statistiques Oderen | 1 242 | 19 km² | 65 h/km² | 38.8% | 5.5% | 22 540 €/an | NC | 2.3 |
| Statistiques Fellering | 1 589 | 21 km² | 76 h/km² | 45.2% | 4.5% | 23 560 €/an | NC | 3.0 |
| Statistiques Wildenstein | 161 | 10 km² | 16 h/km² | 49.1% | 11.2% | 20 040 €/an | NC | - |
| Statistiques Husseren-Wesserling | 1 042 | 5 km² | 208 h/km² | 47.2% | 5.7% | 22 460 €/an | NC | 2.4 |
| Statistiques Storckensohn | 192 | 5 km² | 38 h/km² | 43.8% | 3.6% | 24 370 €/an | NC | - |
| Statistiques Urbès | 438 | 13 km² | 34 h/km² | 47.7% | 6.6% | 22 840 €/an | NC | - |
| Statistiques Saint-Amarin | 2 200 | 12 km² | 183 h/km² | 45.2% | 4.8% | 22 300 €/an | NC | 2.6 |
| Statistiques Ranspach | 790 | 11 km² | 72 h/km² | 45.6% | 4.4% | 22 920 €/an | NC | - |
| Statistiques Mollau | 338 | 9 km² | 38 h/km² | 44.1% | 2.7% | 24 500 €/an | NC | - |
| Statistiques Ventron | 828 | 25 km² | 33 h/km² | 47.1% | 4.1% | 21 910 €/an | 1 734 €/m² | 3.2 |
| Statistiques Mitzach | 381 | 6 km² | 64 h/km² | 49.3% | 5.2% | 25 470 €/an | NC | - |
| Statistiques Moosch | 1 617 | 15 km² | 108 h/km² | 40.3% | 4.1% | 23 280 €/an | NC | - |
| Statistiques Malmerspach | 492 | 3 km² | 164 h/km² | 45.5% | 6.3% | 21 770 €/an | NC | - |
| Statistiques Mittlach | 336 | 11 km² | 31 h/km² | 47.6% | 4.5% | 23 080 €/an | NC | - |
| Statistiques Geishouse | 432 | 7 km² | 62 h/km² | 42.6% | 3.5% | 24 820 €/an | NC | 3.4 |