


Signalement de photo
Merci ! Votre signalement est envoyé !
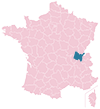
Quel est le nombre d'habitants à Izernore ? Dans quel département et dans quelle région se situe la ville ? Quelle est sa superficie ?
Quels sont les chiffres de la délinquance ?
Découvrez sur cette page toutes les informations essentielles sur la population, la sécurité, les services et l'immobilier à Izernore.
NOUVEAU : Rues sales, dépôts sauvages, dégradations urbaines. Faites votre signalement anonyme, nous nous chargeons de prévenir les autorités compétentes.
| Nombre d'habitants | 2 267 | Classement |
| Age moyen | 39 ans | Classement |
| Pop active | 53.3% | Classement |
| Taux chômage | 3.9% | Classement |
| Pop densité | 108 h/km² | Classement |
| Revenu moyen | 23 500 €/an | Classement |
| Agressions physiques / sexuelles | 0 |
| Cambriolages | 0 |
| Vols / dégradations | 14 |
| Stupéfiants | 0 |
Achat / Vente / Location Votre agence immobilière à Izernore
| Prix moyen | 172 338 € | Prix moyen au m² | 1 693 € |
| Prix moyen | 153 833 € | Prix moyen au m² | 2 305 € |
Carte de la ville de Izernore

Commerce |
|
|---|---|
|
Hypermarché (14km) Arbent |
|
|
Supermarché (4km) Montréal-la-Cluse |
|
| Boulangerie | 2 |
| Boucherie | 1 |
|
Station-service (4km) Montréal-la-Cluse |
|
|
Banque (4km) Montréal-la-Cluse |
|
| La poste | 1 |
| Coiffeur | 2 |
|
Vétérinaire (4km) Montréal-la-Cluse |
|
| Restaurant | 3 |
Santé |
|
|---|---|
| Médecin | 1 |
| Dentiste | 1 |
| Pharmacie | 1 |
Éducation |
|
|---|---|
| Maternelle | 1 |
| Primaire | 1 |
|
Collège (4km) Montréal-la-Cluse |
|
|
Lycée (6km) Bellignat |
|


NOUVEAU : Décharges sauvages, détritus, objets abandonnés, graffitis, nids-de-poule : Déclarer un incident à Izernore


 Marine LE PEN
 Emmanuel MACRON
 Jean-Luc MÉLENCHON
 Éric ZEMMOUR
 Valérie PÉCRESSE
 Jean LASSALLE
 Yannick JADOT
 Nicolas DUPONT-AIGNAN
 Fabien ROUSSEL
 Anne HIDALGO
 Nathalie ARTHAUD
 Philippe POUTOUEmmanuel MACRONMarine LE PEN
| Ville | Habitants | Superficie | Pop densité | Pop active | Taux chômage | Revenu moyen | Prix immobilier | Note globale |
|---|---|---|---|---|---|---|---|---|
| Statistiques Sonthonnax-la-Montagne | 292 | 14 km² | 21 h/km² | 57.5% | 5.1% | 27 530 €/an | 950 €/m² | - |
| Statistiques Béard-Géovreissiat | 1 048 | 5 km² | 210 h/km² | 54.5% | 4% | 24 070 €/an | 1 792 €/m² | 3.1 |
| Statistiques Montréal-la-Cluse | 3 541 | 13 km² | 272 h/km² | 44.4% | 4.7% | 21 010 €/an | 1 778 €/m² | 4.2 |
| Statistiques Groissiat | 1 230 | 6 km² | 205 h/km² | 47% | 3.8% | 25 220 €/an | 2 158 €/m² | - |
| Statistiques Martignat | 1 671 | 13 km² | 129 h/km² | 48.9% | 5% | 24 590 €/an | 1 675 €/m² | - |
| Statistiques Nurieux-Volognat | 990 | 19 km² | 52 h/km² | 52.3% | 4.5% | 25 120 €/an | 1 699 €/m² | 3.4 |
| Statistiques Samognat | 660 | 14 km² | 47 h/km² | 54.2% | 3.3% | 27 660 €/an | 1 798 €/m² | - |
| Statistiques Brion | 576 | 4 km² | 144 h/km² | 44.4% | 3.6% | 25 400 €/an | 2 539 €/m² | - |
| Statistiques Géovreisset | 835 | 3 km² | 278 h/km² | 50.7% | 5% | 25 370 €/an | 1 580 €/m² | - |
| Statistiques Corveissiat | 596 | 23 km² | 26 h/km² | 48.7% | 5.5% | 24 010 €/an | 1 297 €/m² | - |
| Statistiques Bolozon | 95 | 5 km² | 19 h/km² | 45.3% | 8.4% | NC | 1 094 €/m² | - |
| Statistiques Matafelon-Granges | 629 | 22 km² | 29 h/km² | 53.9% | 3.5% | 24 660 €/an | 1 369 €/m² | 3.8 |
| Statistiques Port | 843 | 4 km² | 211 h/km² | 45.4% | 4.2% | 22 270 €/an | 1 350 €/m² | - |
| Statistiques Thoirette-Coisia | 831 | 16 km² | 52 h/km² | 52.3% | 3.9% | 22 790 €/an | 1 549 €/m² | 4.2 |
| Statistiques Bellignat | 3 636 | 8 km² | 455 h/km² | 45.9% | 6.9% | 20 550 €/an | 1 552 €/m² | 4.6 |