


Signalement de photo
Merci ! Votre signalement est envoyé !
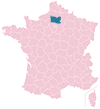
Quel est le nombre d'habitants à Hondainville ? Dans quel département et dans quelle région se situe la ville ? Quelle est sa superficie ?
Quels sont les chiffres de la délinquance ?
Découvrez sur cette page toutes les informations essentielles sur la population, la sécurité, les services et l'immobilier à Hondainville.
NOUVEAU : Rues sales, dépôts sauvages, dégradations urbaines. Faites votre signalement anonyme, nous nous chargeons de prévenir les autorités compétentes.
| Nombre d'habitants | 727 | Classement |
| Age moyen | 40 ans | Classement |
| Pop active | 48.6% | Classement |
| Taux chômage | 4.7% | Classement |
| Pop densité | 121 h/km² | Classement |
| Revenu moyen | 25 590 €/an | Classement |
| Agressions physiques / sexuelles | 0 |
| Cambriolages | 0 |
| Vols / dégradations | 0 |
| Stupéfiants | 0 |
Achat / Vente / Location Votre agence immobilière à Hondainville
| Prix moyen | 183 673 € | Prix moyen au m² | 1 726 € |
Carte de la ville de Hondainville

Commerce |
|
|---|---|
|
Hypermarché (2km) Angy |
|
|
Supermarché (2km) Angy |
|
|
Boulangerie (2km) Angy |
|
|
Boucherie (2km) Saint-Félix |
|
|
Station-service (2km) Angy |
|
|
Banque (4km) Mouy |
|
|
La poste (4km) Mouy |
|
|
Coiffeur (2km) Saint-Félix |
|
|
Vétérinaire (4km) Mouy |
|
|
Restaurant (2km) Saint-Félix |
|
Éducation |
|
|---|---|
|
Maternelle (2km) Saint-Félix |
|
| Primaire | 1 |
|
Collège (4km) Mouy |
|
|
Lycée (8km) Clermont |
|


NOUVEAU : Décharges sauvages, détritus, objets abandonnés, graffitis, nids-de-poule : Déclarer un incident à Hondainville


 Marine LE PEN
 Emmanuel MACRON
 Jean-Luc MÉLENCHON
 Éric ZEMMOUR
 Yannick JADOT
 Valérie PÉCRESSE
 Nicolas DUPONT-AIGNAN
 Fabien ROUSSEL
 Jean LASSALLE
 Anne HIDALGO
 Nathalie ARTHAUD
 Philippe POUTOUEmmanuel MACRONMarine LE PEN
| Ville | Habitants | Superficie | Pop densité | Pop active | Taux chômage | Revenu moyen | Prix immobilier | Note globale |
|---|---|---|---|---|---|---|---|---|
| Statistiques Saint-Félix | 613 | 5 km² | 123 h/km² | 49.1% | 4.6% | 24 380 €/an | 1 932 €/m² | 3.2 |
| Statistiques Angy | 1 139 | 4 km² | 285 h/km² | 47.1% | 5.4% | 23 900 €/an | 1 959 €/m² | 3.2 |
| Statistiques Heilles | 655 | 6 km² | 109 h/km² | 50.2% | 3.2% | 25 520 €/an | 2 081 €/m² | - |
| Statistiques Thury-sous-Clermont | 672 | 5 km² | 134 h/km² | 53.9% | 4.5% | 25 180 €/an | 2 565 €/m² | - |
| Statistiques Mouy | 5 305 | 10 km² | 531 h/km² | 48.4% | 6.9% | 21 110 €/an | 1 841 €/m² | 3.6 |
| Statistiques Hermes | 2 498 | 12 km² | 208 h/km² | 47.5% | 6.4% | 21 990 €/an | 1 919 €/m² | 4.2 |
| Statistiques Mouchy-le-Châtel | 79 | 3 km² | 26 h/km² | 54.4% | 5.1% | NC | 1 252 €/m² | - |
| Statistiques Ansacq | 271 | 8 km² | 34 h/km² | 53.1% | 3.3% | 27 770 €/an | 2 434 €/m² | - |
| Statistiques Berthecourt | 1 595 | 7 km² | 228 h/km² | 51.3% | 6% | 23 820 €/an | 2 026 €/m² | - |
| Statistiques Bury | 2 913 | 17 km² | 171 h/km² | 50% | 5.7% | 23 580 €/an | 2 007 €/m² | 3.0 |
| Statistiques Balagny-sur-Thérain | 1 649 | 7 km² | 236 h/km² | 50% | 4.5% | 23 770 €/an | 1 923 €/m² | 4.0 |
| Statistiques Cauvigny | 1 630 | 18 km² | 91 h/km² | 50.3% | 3.9% | 25 990 €/an | 2 397 €/m² | - |
| Statistiques Villers-Saint-Sépulcre | 1 010 | 7 km² | 144 h/km² | 49.7% | 5.2% | 24 410 €/an | 2 059 €/m² | 1.8 |
| Statistiques Agnetz | 3 055 | 13 km² | 235 h/km² | 50.7% | 2.7% | 27 210 €/an | 2 247 €/m² | 3.0 |
| Statistiques Ponchon | 1 139 | 10 km² | 114 h/km² | 50.7% | 5.9% | 25 210 €/an | 2 010 €/m² | 2.7 |