


Signalement de photo
Merci ! Votre signalement est envoyé !
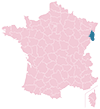
Quel est le nombre d'habitants à Hochstatt ? Dans quel département et dans quelle région se situe la ville ? Quelle est sa superficie ?
Quels sont les chiffres de la délinquance ?
Découvrez sur cette page toutes les informations essentielles sur la population, la sécurité, les services et l'immobilier à Hochstatt.
NOUVEAU : Rues sales, dépôts sauvages, dégradations urbaines. Faites votre signalement anonyme, nous nous chargeons de prévenir les autorités compétentes.
| Nombre d'habitants | 2 177 | Classement |
| Age moyen | 46 ans | Classement |
| Pop active | 46.1% | Classement |
| Taux chômage | 4.3% | Classement |
| Pop densité | 242 h/km² | Classement |
| Revenu moyen | 29 610 €/an | Classement |
| Agressions physiques / sexuelles | 0 |
| Cambriolages | 0 |
| Vols / dégradations | 8 |
| Stupéfiants | 0 |
Achat / Vente / Location Votre agence immobilière à Hochstatt
| Prix moyen | 0 € | Prix moyen au m² | 0 € |
Carte de la ville de Hochstatt

Commerce |
|
|---|---|
|
Hypermarché (2km) Brunstatt-Didenheim |
|
|
Supermarché (2km) Brunstatt-Didenheim |
|
|
Boulangerie (2km) Brunstatt-Didenheim |
|
|
Boucherie (2km) Brunstatt-Didenheim |
|
|
Station-service (2km) Brunstatt-Didenheim |
|
| Banque | 1 |
|
La poste (2km) Brunstatt-Didenheim |
|
| Coiffeur | 1 |
|
Vétérinaire (2km) Brunstatt-Didenheim |
|
| Restaurant | 3 |
Santé |
|
|---|---|
|
Médecin (1km) Brunstatt-Didenheim |
|
| Dentiste | 2 |
|
Pharmacie (2km) Brunstatt-Didenheim |
|
Éducation |
|
|---|---|
| Maternelle | 1 |
| Primaire | 1 |
|
Collège (2km) Brunstatt-Didenheim |
|
|
Lycée (4km) Zillisheim |
|


NOUVEAU : Décharges sauvages, détritus, objets abandonnés, graffitis, nids-de-poule : Déclarer un incident à Hochstatt


 Emmanuel MACRON
 Marine LE PEN
 Jean-Luc MÉLENCHON
 Éric ZEMMOUR
 Yannick JADOT
 Valérie PÉCRESSE
 Jean LASSALLE
 Nicolas DUPONT-AIGNAN
 Nathalie ARTHAUD
 Anne HIDALGO
 Fabien ROUSSEL
 Philippe POUTOUEmmanuel MACRONMarine LE PEN
| Ville | Habitants | Superficie | Pop densité | Pop active | Taux chômage | Revenu moyen | Prix immobilier | Note globale |
|---|---|---|---|---|---|---|---|---|
| Statistiques Froeningen | 849 | 4 km² | 212 h/km² | 47.2% | 3.7% | 28 010 €/an | NC | - |
| Statistiques Brunstatt-Didenheim | 8 172 | 14 km² | 584 h/km² | 47% | 4.9% | 28 330 €/an | NC | 4.2 |
| Statistiques Flaxlanden | 1 391 | 4 km² | 348 h/km² | 46.2% | 2.4% | 31 060 €/an | NC | 5.0 |
| Statistiques Morschwiller-le-Bas | 3 642 | 8 km² | 455 h/km² | 47.4% | 4.6% | 27 010 €/an | NC | 2.6 |
| Statistiques Zillisheim | 2 514 | 8 km² | 314 h/km² | 47.7% | 3.8% | 29 650 €/an | NC | 3.7 |
| Statistiques Heimsbrunn | 1 336 | 11 km² | 121 h/km² | 44.7% | 3.6% | 30 290 €/an | NC | 3.0 |
| Statistiques Mulhouse | 106 341 | 22 km² | 4 834 h/km² | 42.6% | 10.8% | 16 620 €/an | NC | 3.2 |
| Statistiques Reiningue | 1 951 | 19 km² | 103 h/km² | 49.8% | 4% | 27 250 €/an | NC | 1.0 |
| Statistiques Galfingue | 811 | 5 km² | 162 h/km² | 52.3% | 2.8% | 30 510 €/an | NC | - |
| Statistiques Lutterbach | 6 261 | 9 km² | 696 h/km² | 45.1% | 5.8% | 23 660 €/an | NC | 2.8 |
| Statistiques Illfurth | 2 446 | 9 km² | 272 h/km² | 49.8% | 3.1% | 27 340 €/an | NC | - |
| Statistiques Heidwiller | 670 | 4 km² | 168 h/km² | 45.8% | 2.2% | 28 430 €/an | NC | - |
| Statistiques Spechbach | 1 392 | 8 km² | 174 h/km² | 53.2% | 3% | 27 910 €/an | NC | 3.9 |
| Statistiques Bruebach | 1 044 | 7 km² | 149 h/km² | 46.5% | 2.5% | 32 230 €/an | NC | 4.6 |
| Statistiques Riedisheim | 12 163 | 7 km² | 1 738 h/km² | 47.3% | 5.6% | 25 720 €/an | NC | 3.6 |