


Signalement de photo
Merci ! Votre signalement est envoyé !
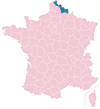
Quel est le nombre d'habitants à Gondecourt ? Dans quel département et dans quelle région se situe la ville ? Quelle est sa superficie ?
Quels sont les chiffres de la délinquance ?
Découvrez sur cette page toutes les informations essentielles sur la population, la sécurité, les services et l'immobilier à Gondecourt.
NOUVEAU : Rues sales, dépôts sauvages, dégradations urbaines. Faites votre signalement anonyme, nous nous chargeons de prévenir les autorités compétentes.
| Nombre d'habitants | 4 050 | Classement |
| Age moyen | 41 ans | Classement |
| Pop active | 47% | Classement |
| Taux chômage | 3.9% | Classement |
| Pop densité | 506 h/km² | Classement |
| Revenu moyen | 26 300 €/an | Classement |
| Agressions physiques / sexuelles | 25 |
| Cambriolages | 25 |
| Vols / dégradations | 32 |
| Stupéfiants | 5 |
Achat / Vente / Location Votre agence immobilière à Gondecourt
| Prix moyen | 295 958 € | Prix moyen au m² | 2 946 € |
| Prix moyen | 210 250 € | Prix moyen au m² | 2 111 € |
Carte de la ville de Gondecourt

Commerce |
|
|---|---|
|
Hypermarché (4km) Seclin |
|
|
Supermarché (2km) Houplin-Ancoisne |
|
| Boulangerie | 2 |
| Boucherie | 1 |
|
Station-service (4km) Seclin |
|
| Banque | 1 |
| La poste | 1 |
| Coiffeur | 7 |
|
Vétérinaire (4km) Seclin |
|
| Restaurant | 7 |
Santé |
|
|---|---|
| Médecin | 5 |
| Dentiste | 3 |
| Pharmacie | 2 |
Éducation |
|
|---|---|
| Maternelle | 2 |
| Primaire | 1 |
| Collège | 1 |
| Lycée | 1 |


NOUVEAU : Décharges sauvages, détritus, objets abandonnés, graffitis, nids-de-poule : Déclarer un incident à Gondecourt


 Emmanuel MACRON
 Marine LE PEN
 Jean-Luc MÉLENCHON
 Yannick JADOT
 Éric ZEMMOUR
 Valérie PÉCRESSE
 Fabien ROUSSEL
 Jean LASSALLE
 Anne HIDALGO
 Nicolas DUPONT-AIGNAN
 Nathalie ARTHAUD
 Philippe POUTOUEmmanuel MACRONMarine LE PEN
| Ville | Habitants | Superficie | Pop densité | Pop active | Taux chômage | Revenu moyen | Prix immobilier | Note globale |
|---|---|---|---|---|---|---|---|---|
| Statistiques Herrin | 423 | 2 km² | 212 h/km² | 48.2% | 4% | 27 820 €/an | 1 936 €/m² | - |
| Statistiques Chemy | 780 | 3 km² | 260 h/km² | 48.6% | 2.1% | 29 310 €/an | 2 403 €/m² | 3.5 |
| Statistiques Houplin-Ancoisne | 3 275 | 6 km² | 546 h/km² | 48.7% | 4.7% | 25 620 €/an | 2 345 €/m² | - |
| Statistiques Allennes-les-Marais | 3 567 | 6 km² | 595 h/km² | 49.6% | 4.1% | 26 280 €/an | 1 759 €/m² | - |
| Statistiques Seclin | 12 834 | 17 km² | 755 h/km² | 45.7% | 6.3% | 22 460 €/an | 2 208 €/m² | 4.3 |
| Statistiques Camphin-en-Carembault | 1 714 | 7 km² | 245 h/km² | 48.5% | 4.3% | 26 920 €/an | 2 276 €/m² | 3.5 |
| Statistiques Carnin | 1 076 | 2 km² | 538 h/km² | 48.5% | 2.7% | 27 100 €/an | 2 190 €/m² | - |
| Statistiques Noyelles-lès-Seclin | 845 | 2 km² | 423 h/km² | 45.6% | 2.6% | 28 500 €/an | 3 263 €/m² | 4.2 |
| Statistiques Phalempin | 4 849 | 8 km² | 606 h/km² | 48.5% | 3.1% | 26 850 €/an | 2 193 €/m² | 4.7 |
| Statistiques Annoeullin | 10 780 | 9 km² | 1 198 h/km² | 44.9% | 5.5% | 23 710 €/an | 1 993 €/m² | 3.4 |
| Statistiques Don | 1 412 | 2 km² | 706 h/km² | 48.2% | 3.5% | 24 970 €/an | 1 906 €/m² | - |
| Statistiques Wavrin | 7 773 | 14 km² | 555 h/km² | 49% | 5.4% | 23 980 €/an | 2 107 €/m² | 3.7 |
| Statistiques Templemars | 3 635 | 5 km² | 727 h/km² | 47.8% | 4.5% | 26 250 €/an | 2 356 €/m² | 3.6 |
| Statistiques Haubourdin | 14 757 | 5 km² | 2 951 h/km² | 48.2% | 6.3% | 21 490 €/an | 2 083 €/m² | 3.4 |
| Statistiques Emmerin | 3 053 | 5 km² | 611 h/km² | 47.6% | 3.5% | 27 020 €/an | 2 402 €/m² | 3.5 |