


Signalement de photo
Merci ! Votre signalement est envoyé !
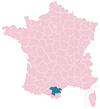
Quel est le nombre d'habitants à Ginestas ? Dans quel département et dans quelle région se situe la ville ? Quelle est sa superficie ?
Quels sont les chiffres de la délinquance ?
Découvrez sur cette page toutes les informations essentielles sur la population, la sécurité, les services et l'immobilier à Ginestas.
NOUVEAU : Rues sales, dépôts sauvages, dégradations urbaines. Faites votre signalement anonyme, nous nous chargeons de prévenir les autorités compétentes.
| Nombre d'habitants | 1 547 | Classement |
| Age moyen | 44 ans | Classement |
| Pop active | 40.4% | Classement |
| Taux chômage | 6.1% | Classement |
| Pop densité | 155 h/km² | Classement |
| Revenu moyen | 21 930 €/an | Classement |
| Agressions physiques / sexuelles | 0 |
| Cambriolages | 0 |
| Vols / dégradations | 6 |
| Stupéfiants | 0 |
Achat / Vente / Location Votre agence immobilière à Ginestas
| Prix moyen | 192 818 € | Prix moyen au m² | 1 806 € |
| Prix moyen | 54 142 € | Prix moyen au m² | 1 074 € |
Carte de la ville de Ginestas

Commerce |
|
|---|---|
|
Hypermarché (12km) Lézignan-Corbières |
|
|
Supermarché (4km) Saint-Marcel-sur-Aude |
|
| Boulangerie | 2 |
|
Boucherie (4km) Saint-Marcel-sur-Aude |
|
|
Station-service (4km) Saint-Marcel-sur-Aude |
|
| Banque | 2 |
| La poste | 1 |
| Coiffeur | 1 |
|
Vétérinaire (3km) Ventenac-en-Minervois |
|
| Restaurant | 8 |
Santé |
|
|---|---|
| Médecin | 1 |
|
Dentiste (5km) Canet |
|
| Pharmacie | 1 |
Éducation |
|
|---|---|
| Maternelle | 1 |
| Primaire | 1 |
|
Collège (4km) Saint-Nazaire-d'Aude |
|
|
Lycée (12km) Lézignan-Corbières |
|


NOUVEAU : Décharges sauvages, détritus, objets abandonnés, graffitis, nids-de-poule : Déclarer un incident à Ginestas


 Marine LE PEN
 Emmanuel MACRON
 Jean-Luc MÉLENCHON
 Éric ZEMMOUR
 Jean LASSALLE
 Valérie PÉCRESSE
 Yannick JADOT
 Fabien ROUSSEL
 Anne HIDALGO
 Nicolas DUPONT-AIGNAN
 Philippe POUTOU
 Nathalie ARTHAUDEmmanuel MACRONMarine LE PEN
| Ville | Habitants | Superficie | Pop densité | Pop active | Taux chômage | Revenu moyen | Prix immobilier | Note globale |
|---|---|---|---|---|---|---|---|---|
| Statistiques Mirepeisset | 749 | 5 km² | 150 h/km² | 45.8% | 6.1% | 21 260 €/an | 1 999 €/m² | - |
| Statistiques Ventenac-en-Minervois | 581 | 6 km² | 97 h/km² | 38.9% | 3.6% | 22 260 €/an | 1 873 €/m² | - |
| Statistiques Sainte-Valière | 529 | 6 km² | 88 h/km² | 45.2% | 6.6% | 20 560 €/an | 1 547 €/m² | - |
| Statistiques Raissac-d'Aude | 246 | 6 km² | 41 h/km² | 41.5% | 11% | 19 780 €/an | 1 739 €/m² | - |
| Statistiques Saint-Nazaire-d'Aude | 2 091 | 9 km² | 232 h/km² | 42.7% | 6.4% | 21 930 €/an | 1 985 €/m² | 2.7 |
| Statistiques Saint-Marcel-sur-Aude | 2 027 | 8 km² | 253 h/km² | 43.8% | 6% | 20 990 €/an | 1 829 €/m² | 3.9 |
| Statistiques Pouzols-Minervois | 587 | 10 km² | 59 h/km² | 40.5% | 8.2% | 19 810 €/an | 2 194 €/m² | 4.4 |
| Statistiques Paraza | 701 | 9 km² | 78 h/km² | 38.9% | 6.8% | 20 830 €/an | 1 837 €/m² | 3.2 |
| Statistiques Marcorignan | 1 303 | 6 km² | 217 h/km² | 45.1% | 6.8% | 22 020 €/an | 1 735 €/m² | 1.6 |
| Statistiques Canet | 1 833 | 14 km² | 131 h/km² | 45.2% | 7% | 21 930 €/an | 1 950 €/m² | - |
| Statistiques Sallèles-d'Aude | 3 064 | 13 km² | 236 h/km² | 44.5% | 7.4% | 21 870 €/an | 1 645 €/m² | 4.0 |
| Statistiques Mailhac | 581 | 11 km² | 53 h/km² | 44.8% | 5% | 19 200 €/an | 1 536 €/m² | 4.4 |
| Statistiques Bize-Minervois | 1 258 | 21 km² | 60 h/km² | 40.1% | 6.7% | 20 550 €/an | 1 788 €/m² | 3.6 |
| Statistiques Villedaigne | 548 | 2 km² | 274 h/km² | 39.6% | 7.1% | 17 280 €/an | 1 848 €/m² | 2.4 |
| Statistiques Névian | 1 280 | 14 km² | 91 h/km² | 46.4% | 4.9% | 22 270 €/an | 1 534 €/m² | - |