


Signalement de photo
Merci ! Votre signalement est envoyé !
Quel est le nombre d'habitants à Garches ? Dans quel département et dans quelle région se situe la ville ? Quelle est sa superficie ?
Quels sont les chiffres de la délinquance ?
Découvrez sur cette page toutes les informations essentielles sur la population, la sécurité, les services et l'immobilier à Garches.
NOUVEAU : Rues sales, dépôts sauvages, dégradations urbaines. Faites votre signalement anonyme, nous nous chargeons de prévenir les autorités compétentes.
| Nombre d'habitants | 17 898 | Classement |
| Age moyen | 43 ans | Classement |
| Pop active | 46.9% | Classement |
| Taux chômage | 4.6% | Classement |
| Pop densité | 5 966 h/km² | Classement |
| Revenu moyen | 36 150 €/an | Classement |
| Agressions physiques / sexuelles | 125 |
| Cambriolages | 109 |
| Vols / dégradations | 337 |
| Stupéfiants | 14 |
Achat / Vente / Location Votre agence immobilière à Garches
| Prix moyen | 1 130 192 € | Prix moyen au m² | 8 125 € |
| Prix moyen | 422 734 € | Prix moyen au m² | 6 259 € |
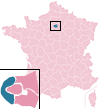
Carte de la ville de Garches

Commerce |
|
|---|---|
|
Hypermarché (1km) Vaucresson |
|
| Supermarché | 4 |
| Boulangerie | 5 |
| Boucherie | 4 |
| Station-service | 1 |
| Banque | 10 |
| La poste | 1 |
| Coiffeur | 9 |
| Vétérinaire | 3 |
| Restaurant | 25 |
Santé |
|
|---|---|
| Médecin | 324 |
| Dentiste | 17 |
| Pharmacie | 8 |
Éducation |
|
|---|---|
| Maternelle | 4 |
| Primaire | 5 |
| Collège | 1 |
|
Lycée (1km) Vaucresson |
|


NOUVEAU : Décharges sauvages, détritus, objets abandonnés, graffitis, nids-de-poule : Déclarer un incident à Garches


 Emmanuel MACRON
 Jean-Luc MÉLENCHON
 Valérie PÉCRESSE
 Marine LE PEN
 Éric ZEMMOUR
 Yannick JADOT
 Jean LASSALLE
 Nicolas DUPONT-AIGNAN
 Fabien ROUSSEL
 Anne HIDALGO
 Philippe POUTOU
 Nathalie ARTHAUDEmmanuel MACRONMarine LE PEN
| Ville | Habitants | Superficie | Pop densité | Pop active | Taux chômage | Revenu moyen | Prix immobilier | Note globale |
|---|---|---|---|---|---|---|---|---|
| Statistiques Vaucresson | 8 566 | 3 km² | 2 855 h/km² | 47.9% | 3.5% | 41 320 €/an | 5 013 €/m² | 3.6 |
| Statistiques Marnes-la-Coquette | 1 745 | 3 km² | 582 h/km² | 47.3% | 4.4% | 41 740 €/an | 6 263 €/m² | 2.2 |
| Statistiques Ville-d'Avray | 10 694 | 4 km² | 2 674 h/km² | 50.1% | 4.4% | 38 490 €/an | 5 659 €/m² | 3.7 |
| Statistiques Saint-Cloud | 29 727 | 8 km² | 3 716 h/km² | 48.6% | 3.8% | 39 760 €/an | 7 004 €/m² | 2.8 |
| Statistiques La Celle-Saint-Cloud | 20 476 | 6 km² | 3 413 h/km² | 46.9% | 4.6% | 29 510 €/an | 4 381 €/m² | 2.2 |
| Statistiques Sèvres | 22 618 | 4 km² | 5 655 h/km² | 52.3% | 5.4% | 33 680 €/an | 6 251 €/m² | 4.2 |
| Statistiques Croissy-sur-Seine | 10 399 | 3 km² | 3 466 h/km² | 47.2% | 3.6% | 38 780 €/an | 5 999 €/m² | 3.5 |
| Statistiques Bougival | 9 031 | 3 km² | 3 010 h/km² | 49.3% | 4.7% | 31 630 €/an | 4 885 €/m² | 2.5 |
| Statistiques Puteaux | 43 672 | 3 km² | 14 557 h/km² | 57.4% | 5.5% | 30 980 €/an | 6 767 €/m² | 3.9 |
| Statistiques Suresnes | 49 104 | 4 km² | 12 276 h/km² | 55.4% | 5.5% | 31 810 €/an | 6 827 €/m² | 3.5 |
| Statistiques Vélizy-Villacoublay | 22 713 | 9 km² | 2 524 h/km² | 55% | 3.8% | 28 610 €/an | 4 548 €/m² | 4.3 |
| Statistiques Le Chesnay-Rocquencourt | 30 924 | 7 km² | 4 418 h/km² | 46% | 4.1% | 33 520 €/an | 5 648 €/m² | 3.6 |
| Statistiques Rueil-Malmaison | 78 186 | 15 km² | 5 212 h/km² | 50.6% | 4.7% | 32 980 €/an | 6 066 €/m² | 3.5 |
| Statistiques Viroflay | 16 960 | 3 km² | 5 653 h/km² | 49.1% | 3% | 36 100 €/an | 5 966 €/m² | 4.1 |
| Statistiques Chaville | 19 991 | 4 km² | 4 998 h/km² | 55.1% | 4.5% | 32 290 €/an | 5 906 €/m² | 3.4 |