


Signalement de photo
Merci ! Votre signalement est envoyé !
Quel est le nombre d'habitants à François ? Dans quel département et dans quelle région se situe la ville ? Quelle est sa superficie ?
Quels sont les chiffres de la délinquance ?
Découvrez sur cette page toutes les informations essentielles sur la population, la sécurité, les services et l'immobilier à François.
NOUVEAU : Rues sales, dépôts sauvages, dégradations urbaines. Faites votre signalement anonyme, nous nous chargeons de prévenir les autorités compétentes.
| Nombre d'habitants | 953 | Classement |
| Age moyen | 42 ans | Classement |
| Pop active | 48.2% | Classement |
| Taux chômage | 3.1% | Classement |
| Pop densité | 106 h/km² | Classement |
| Revenu moyen | 27 610 €/an | Classement |
| Agressions physiques / sexuelles | 0 |
| Cambriolages | 0 |
| Vols / dégradations | 0 |
| Stupéfiants | 0 |
Achat / Vente / Location Votre agence immobilière à François
| Prix moyen | 120 207 € | Prix moyen au m² | 930 € |
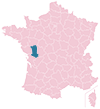
Carte de la ville de François

Commerce |
|
|---|---|
|
Hypermarché (3km) Chauray |
|
|
Supermarché (3km) Chauray |
|
|
Boulangerie (3km) Saint-Gelais |
|
|
Boucherie (3km) Chauray |
|
|
Station-service (3km) Chauray |
|
|
Banque (3km) Chauray |
|
|
La poste (3km) Chauray |
|
| Coiffeur | 1 |
|
Vétérinaire (4km) La Crèche |
|
|
Restaurant (3km) Saint-Gelais |
|
Santé |
|
|---|---|
|
Médecin (3km) Saint-Gelais |
|
|
Dentiste (3km) Chauray |
|
|
Pharmacie (3km) Chauray |
|


NOUVEAU : Décharges sauvages, détritus, objets abandonnés, graffitis, nids-de-poule : Déclarer un incident à François


 Emmanuel MACRON
 Marine LE PEN
 Jean-Luc MÉLENCHON
 Yannick JADOT
 Valérie PÉCRESSE
 Fabien ROUSSEL
 Éric ZEMMOUR
 Nicolas DUPONT-AIGNAN
 Jean LASSALLE
 Anne HIDALGO
 Philippe POUTOU
 Nathalie ARTHAUDEmmanuel MACRONMarine LE PEN
| Ville | Habitants | Superficie | Pop densité | Pop active | Taux chômage | Revenu moyen | Prix immobilier | Note globale |
|---|---|---|---|---|---|---|---|---|
| Statistiques Saint-Gelais | 2 183 | 16 km² | 136 h/km² | 50.6% | 2.3% | 26 510 €/an | 1 670 €/m² | - |
| Statistiques Chauray | 7 151 | 15 km² | 477 h/km² | 47% | 3.2% | 26 010 €/an | 1 805 €/m² | 3.4 |
| Statistiques La Crèche | 5 732 | 35 km² | 164 h/km² | 47.2% | 2.6% | 25 010 €/an | 1 399 €/m² | 4.2 |
| Statistiques Échiré | 3 517 | 31 km² | 113 h/km² | 46.7% | 3.2% | 25 850 €/an | 1 653 €/m² | 4.2 |
| Statistiques Cherveux | 1 898 | 22 km² | 86 h/km² | 48.9% | 1.9% | 24 540 €/an | 1 291 €/m² | - |
| Statistiques Vouillé | 3 431 | 22 km² | 156 h/km² | 46.1% | 2.4% | 26 430 €/an | 1 562 €/m² | - |
| Statistiques Fressines | 1 756 | 10 km² | 176 h/km² | 50.7% | 2.6% | 26 070 €/an | 1 618 €/m² | 4.2 |
| Statistiques Sainte-Néomaye | 1 334 | 11 km² | 121 h/km² | 50.7% | 4% | 23 810 €/an | 1 439 €/m² | - |
| Statistiques Azay-le-Brûlé | 1 977 | 22 km² | 90 h/km² | 51.2% | 3.8% | 24 070 €/an | 1 375 €/m² | - |
| Statistiques Sciecq | 653 | 4 km² | 163 h/km² | 40% | 2.3% | 27 040 €/an | 1 450 €/m² | - |
| Statistiques Auge | 881 | 23 km² | 38 h/km² | 50.9% | 4.3% | 23 210 €/an | 1 264 €/m² | - |
| Statistiques Romans | 713 | 11 km² | 65 h/km² | 51.2% | 4.1% | 23 950 €/an | 1 517 €/m² | 2.8 |
| Statistiques Saint-Christophe-sur-Roc | 575 | 11 km² | 52 h/km² | 53.2% | 3.8% | 23 470 €/an | 627 €/m² | - |
| Statistiques Aigondigné | 4 660 | 70 km² | 67 h/km² | 50.9% | 3% | 24 740 €/an | 1 270 €/m² | 3.4 |
| Statistiques Niort | 59 309 | 68 km² | 872 h/km² | 46.9% | 6.2% | 23 120 €/an | 1 563 €/m² | 3.2 |