


Signalement de photo
Merci ! Votre signalement est envoyé !
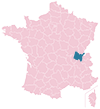
Quel est le nombre d'habitants à Feillens ? Dans quel département et dans quelle région se situe la ville ? Quelle est sa superficie ?
Quels sont les chiffres de la délinquance ?
Découvrez sur cette page toutes les informations essentielles sur la population, la sécurité, les services et l'immobilier à Feillens.
NOUVEAU : Rues sales, dépôts sauvages, dégradations urbaines. Faites votre signalement anonyme, nous nous chargeons de prévenir les autorités compétentes.
| Nombre d'habitants | 3 381 | Classement |
| Age moyen | 43 ans | Classement |
| Pop active | 49.9% | Classement |
| Taux chômage | 3.7% | Classement |
| Pop densité | 225 h/km² | Classement |
| Revenu moyen | 24 360 €/an | Classement |
| Agressions physiques / sexuelles | 6 |
| Cambriolages | 5 |
| Vols / dégradations | 16 |
| Stupéfiants | 0 |
Achat / Vente / Location Votre agence immobilière à Feillens
| Prix moyen | 141 282 € | Prix moyen au m² | 1 356 € |
| Prix moyen | 128 850 € | Prix moyen au m² | 1 814 € |
Carte de la ville de Feillens

Commerce |
|
|---|---|
|
Hypermarché (5km) Mâcon |
|
| Supermarché | 1 |
| Boulangerie | 2 |
|
Boucherie (2km) Manziat |
|
| Station-service | 1 |
| Banque | 2 |
| La poste | 1 |
| Coiffeur | 8 |
| Vétérinaire | 1 |
| Restaurant | 4 |
Santé |
|
|---|---|
| Médecin | 4 |
| Dentiste | 2 |
| Pharmacie | 1 |
Éducation |
|
|---|---|
| Maternelle | 2 |
| Primaire | 2 |
| Collège | 1 |
|
Lycée (5km) Mâcon |
|


NOUVEAU : Décharges sauvages, détritus, objets abandonnés, graffitis, nids-de-poule : Déclarer un incident à Feillens


 Emmanuel MACRON
 Marine LE PEN
 Jean-Luc MÉLENCHON
 Éric ZEMMOUR
 Valérie PÉCRESSE
 Yannick JADOT
 Jean LASSALLE
 Nicolas DUPONT-AIGNAN
 Fabien ROUSSEL
 Anne HIDALGO
 Philippe POUTOU
 Nathalie ARTHAUDEmmanuel MACRONMarine LE PEN
| Ville | Habitants | Superficie | Pop densité | Pop active | Taux chômage | Revenu moyen | Prix immobilier | Note globale |
|---|---|---|---|---|---|---|---|---|
| Statistiques Vésines | 98 | 4 km² | 25 h/km² | 54.1% | 6.1% | NC | 1 324 €/m² | - |
| Statistiques Manziat | 1 955 | 13 km² | 150 h/km² | 48.2% | 2.9% | 25 260 €/an | 1 629 €/m² | - |
| Statistiques Replonges | 3 899 | 17 km² | 229 h/km² | 46.8% | 3.6% | 24 890 €/an | 1 771 €/m² | 2.8 |
| Statistiques Sancé | 2 165 | 7 km² | 309 h/km² | 47.9% | 3.8% | 25 880 €/an | 1 814 €/m² | - |
| Statistiques Saint-André-de-Bâgé | 809 | 3 km² | 270 h/km² | 50.1% | 3.8% | 25 800 €/an | 2 246 €/m² | - |
| Statistiques Bâgé-Dommartin | 4 065 | 57 km² | 71 h/km² | 50% | 3.6% | 24 880 €/an | 1 742 €/m² | 3.0 |
| Statistiques Saint-Laurent-sur-Saône | 1 659 | 1 km² | 1 659 h/km² | 55% | 7.3% | 19 550 €/an | 1 426 €/m² | 3.1 |
| Statistiques Mâcon | 34 448 | 27 km² | 1 276 h/km² | 43.4% | 7.3% | 19 320 €/an | 1 593 €/m² | 2.8 |
| Statistiques Bâgé-le-Châtel | 979 | 1 km² | 979 h/km² | 47.2% | 4.1% | 22 860 €/an | 1 897 €/m² | 4.0 |
| Statistiques Asnières-sur-Saône | 77 | 5 km² | 15 h/km² | 48.1% | 6.5% | NC | 1 351 €/m² | - |
| Statistiques Senozan | 1 127 | 5 km² | 225 h/km² | 44.5% | 3.5% | 24 700 €/an | 1 870 €/m² | - |
| Statistiques Crottet | 1 818 | 12 km² | 152 h/km² | 48.2% | 3.2% | 24 310 €/an | 2 012 €/m² | - |
| Statistiques Saint-Martin-Belle-Roche | 1 390 | 5 km² | 278 h/km² | 46.6% | 3.8% | 24 790 €/an | 1 676 €/m² | - |
| Statistiques Ozan | 725 | 7 km² | 104 h/km² | 52% | 4% | 23 270 €/an | 1 986 €/m² | 3.4 |
| Statistiques Hurigny | 1 918 | 9 km² | 213 h/km² | 47.8% | 3.3% | 27 390 €/an | 2 009 €/m² | 3.3 |