


Signalement de photo
Merci ! Votre signalement est envoyé !
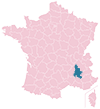
Quel est le nombre d'habitants à Espeluche ? Dans quel département et dans quelle région se situe la ville ? Quelle est sa superficie ?
Quels sont les chiffres de la délinquance ?
Découvrez sur cette page toutes les informations essentielles sur la population, la sécurité, les services et l'immobilier à Espeluche.
NOUVEAU : Rues sales, dépôts sauvages, dégradations urbaines. Faites votre signalement anonyme, nous nous chargeons de prévenir les autorités compétentes.
| Nombre d'habitants | 1 126 | Classement |
| Age moyen | 42 ans | Classement |
| Pop active | 51.3% | Classement |
| Taux chômage | 4.7% | Classement |
| Pop densité | 102 h/km² | Classement |
| Revenu moyen | 25 600 €/an | Classement |
| Agressions physiques / sexuelles | 0 |
| Cambriolages | 0 |
| Vols / dégradations | 7 |
| Stupéfiants | 0 |
Achat / Vente / Location Votre agence immobilière à Espeluche
| Prix moyen | 206 878 € | Prix moyen au m² | 2 047 € |
| Prix moyen | 68 570 € | Prix moyen au m² | 1 308 € |
Carte de la ville de Espeluche

Commerce |
|
|---|---|
|
Hypermarché (8km) Montélimar |
|
|
Supermarché (8km) Montélimar |
|
| Boulangerie | 1 |
|
Boucherie (8km) Saint-Gervais-sur-Roubion |
|
|
Station-service (4km) Montboucher-sur-Jabron |
|
|
Banque (8km) Montélimar |
|
|
La poste (5km) La Bâtie-Rolland |
|
| Coiffeur | 2 |
|
Vétérinaire (8km) Montélimar |
|
| Restaurant | 2 |
Santé |
|
|---|---|
| Médecin | 1 |
|
Dentiste (4km) Montboucher-sur-Jabron |
|
|
Pharmacie (4km) Montboucher-sur-Jabron |
|
Éducation |
|
|---|---|
| Maternelle | 1 |
| Primaire | 1 |
|
Collège (8km) Montélimar |
|
|
Lycée (8km) Montélimar |
|


NOUVEAU : Décharges sauvages, détritus, objets abandonnés, graffitis, nids-de-poule : Déclarer un incident à Espeluche


 Marine LE PEN
 Emmanuel MACRON
 Jean-Luc MÉLENCHON
 Éric ZEMMOUR
 Yannick JADOT
 Valérie PÉCRESSE
 Nicolas DUPONT-AIGNAN
 Jean LASSALLE
 Fabien ROUSSEL
 Anne HIDALGO
 Nathalie ARTHAUD
 Philippe POUTOUEmmanuel MACRONMarine LE PEN
| Ville | Habitants | Superficie | Pop densité | Pop active | Taux chômage | Revenu moyen | Prix immobilier | Note globale |
|---|---|---|---|---|---|---|---|---|
| Statistiques Puygiron | 462 | 7 km² | 66 h/km² | 47.8% | 3.7% | 24 110 €/an | 2 511 €/m² | - |
| Statistiques Rochefort-en-Valdaine | 364 | 13 km² | 28 h/km² | 48.4% | 2.5% | 24 380 €/an | 1 989 €/m² | - |
| Statistiques Montboucher-sur-Jabron | 2 507 | 10 km² | 251 h/km² | 46.5% | 3.9% | 25 030 €/an | 1 964 €/m² | 4.0 |
| Statistiques La Bâtie-Rolland | 1 049 | 8 km² | 131 h/km² | 47.1% | 5.2% | 23 930 €/an | 1 933 €/m² | - |
| Statistiques Allan | 1 874 | 29 km² | 65 h/km² | 47.2% | 4% | 26 490 €/an | 2 813 €/m² | - |
| Statistiques La Touche | 261 | 8 km² | 33 h/km² | 47.5% | 4.2% | 21 640 €/an | 1 733 €/m² | - |
| Statistiques Malataverne | 2 218 | 17 km² | 130 h/km² | 49.3% | 5.8% | 25 230 €/an | 1 846 €/m² | 4.2 |
| Statistiques Montjoyer | 278 | 18 km² | 15 h/km² | 48.6% | 5.4% | 24 030 €/an | 2 205 €/m² | - |
| Statistiques Portes-en-Valdaine | 441 | 15 km² | 29 h/km² | 47.6% | 7.7% | 23 680 €/an | 2 057 €/m² | - |
| Statistiques Saint-Marcel-lès-Sauzet | 1 250 | 4 km² | 313 h/km² | 49.2% | 3.4% | 25 390 €/an | 1 820 €/m² | 3.1 |
| Statistiques Saint-Gervais-sur-Roubion | 1 084 | 15 km² | 72 h/km² | 50.9% | 5.7% | 22 840 €/an | 2 400 €/m² | 4.2 |
| Statistiques Montélimar | 40 399 | 47 km² | 860 h/km² | 42.6% | 7.4% | 21 350 €/an | 1 740 €/m² | 2.7 |
| Statistiques Bonlieu-sur-Roubion | 464 | 6 km² | 77 h/km² | 50% | 4.7% | 24 250 €/an | 2 163 €/m² | - |
| Statistiques Châteauneuf-du-Rhône | 2 796 | 27 km² | 104 h/km² | 46.3% | 5.1% | 22 390 €/an | 2 264 €/m² | 3.0 |
| Statistiques Sauzet | 1 825 | 19 km² | 96 h/km² | 46.8% | 3.9% | 26 630 €/an | 1 860 €/m² | 4.1 |