


Signalement de photo
Merci ! Votre signalement est envoyé !
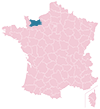
Quel est le nombre d'habitants à Épron ? Dans quel département et dans quelle région se situe la ville ? Quelle est sa superficie ?
Quels sont les chiffres de la délinquance ?
Découvrez sur cette page toutes les informations essentielles sur la population, la sécurité, les services et l'immobilier à Épron.
NOUVEAU : Rues sales, dépôts sauvages, dégradations urbaines. Faites votre signalement anonyme, nous nous chargeons de prévenir les autorités compétentes.
| Nombre d'habitants | 1 672 | Classement |
| Age moyen | 44 ans | Classement |
| Pop active | 30.8% | Classement |
| Taux chômage | 3.2% | Classement |
| Pop densité | 1 672 h/km² | Classement |
| Revenu moyen | 29 720 €/an | Classement |
| Agressions physiques / sexuelles | 0 |
| Cambriolages | 0 |
| Vols / dégradations | 0 |
| Stupéfiants | 0 |
Achat / Vente / Location Votre agence immobilière à Épron
| Prix moyen | 267 000 € | Prix moyen au m² | 2 447 € |
| Prix moyen | 160 691 € | Prix moyen au m² | 2 705 € |
Carte de la ville de Épron

Commerce |
|
|---|---|
|
Hypermarché (4km) Caen |
|
|
Supermarché (2km) Saint-Contest |
|
|
Boulangerie (2km) Cambes-en-Plaine |
|
| Boucherie | 1 |
|
Station-service (2km) Saint-Contest |
|
|
Banque (2km) Saint-Contest |
|
|
La poste (2km) Cambes-en-Plaine |
|
| Coiffeur | 2 |
| Vétérinaire | 6 |
| Restaurant | 1 |
Santé |
|
|---|---|
| Médecin | 7 |
| Dentiste | 2 |
| Pharmacie | 1 |


NOUVEAU : Décharges sauvages, détritus, objets abandonnés, graffitis, nids-de-poule : Déclarer un incident à Épron


 Emmanuel MACRON
 Jean-Luc MÉLENCHON
 Marine LE PEN
 Yannick JADOT
 Valérie PÉCRESSE
 Éric ZEMMOUR
 Fabien ROUSSEL
 Nicolas DUPONT-AIGNAN
 Anne HIDALGO
 Jean LASSALLE
 Nathalie ARTHAUD
 Philippe POUTOUEmmanuel MACRONMarine LE PEN
| Ville | Habitants | Superficie | Pop densité | Pop active | Taux chômage | Revenu moyen | Prix immobilier | Note globale |
|---|---|---|---|---|---|---|---|---|
| Statistiques Cambes-en-Plaine | 1 807 | 3 km² | 602 h/km² | 45.7% | 2.7% | 27 960 €/an | 2 322 €/m² | 4.4 |
| Statistiques Saint-Contest | 2 487 | 8 km² | 311 h/km² | 45.2% | 3.3% | 29 500 €/an | 2 256 €/m² | - |
| Statistiques Villons-les-Buissons | 815 | 4 km² | 204 h/km² | 42.9% | 3.7% | 32 390 €/an | 2 003 €/m² | - |
| Statistiques Biéville-Beuville | 3 738 | 11 km² | 340 h/km² | 44.2% | 3.5% | 28 530 €/an | 3 134 €/m² | 4.9 |
| Statistiques Mathieu | 2 339 | 9 km² | 260 h/km² | 43.7% | 2.7% | 32 520 €/an | 3 153 €/m² | 4.2 |
| Statistiques Anisy | 776 | 4 km² | 194 h/km² | 44.8% | 2.4% | 32 490 €/an | 2 477 €/m² | - |
| Statistiques Caen | 108 200 | 26 km² | 4 162 h/km² | 43.9% | 7.2% | 21 600 €/an | 2 431 €/m² | 3.7 |
| Statistiques Hérouville-Saint-Clair | 22 227 | 11 km² | 2 021 h/km² | 44.7% | 9% | 18 840 €/an | 1 881 €/m² | 3.9 |
| Statistiques Saint-Germain-la-Blanche-Herbe | 2 403 | 3 km² | 801 h/km² | 47.6% | 7.4% | 20 720 €/an | 1 830 €/m² | 3.4 |
| Statistiques Blainville-sur-Orne | 5 876 | 7 km² | 839 h/km² | 49.2% | 6.6% | 22 010 €/an | 2 045 €/m² | 4.2 |
| Statistiques Authie | 1 676 | 3 km² | 559 h/km² | 48.2% | 2.7% | 28 000 €/an | 3 315 €/m² | 3.6 |
| Statistiques Colombelles | 7 022 | 7 km² | 1 003 h/km² | 47.3% | 6.9% | 19 440 €/an | 2 082 €/m² | 2.6 |
| Statistiques Périers-sur-le-Dan | 574 | 3 km² | 191 h/km² | 44.3% | 3.8% | 32 160 €/an | 2 834 €/m² | 1.2 |
| Statistiques Louvigny | 2 646 | 6 km² | 441 h/km² | 46.4% | 4.2% | 25 630 €/an | 2 233 €/m² | 2.8 |
| Statistiques Colomby-Anguerny | 1 306 | 6 km² | 218 h/km² | 47.2% | 3.8% | 29 170 €/an | 2 645 €/m² | 3.6 |