


Signalement de photo
Merci ! Votre signalement est envoyé !
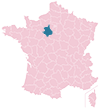
Quel est le nombre d'habitants à Épernon ? Dans quel département et dans quelle région se situe la ville ? Quelle est sa superficie ?
Quels sont les chiffres de la délinquance ?
Découvrez sur cette page toutes les informations essentielles sur la population, la sécurité, les services et l'immobilier à Épernon.
NOUVEAU : Rues sales, dépôts sauvages, dégradations urbaines. Faites votre signalement anonyme, nous nous chargeons de prévenir les autorités compétentes.
| Nombre d'habitants | 5 549 | Classement |
| Age moyen | 41 ans | Classement |
| Pop active | 54.3% | Classement |
| Taux chômage | 6.3% | Classement |
| Pop densité | 925 h/km² | Classement |
| Revenu moyen | 23 440 €/an | Classement |
| Agressions physiques / sexuelles | 71 |
| Cambriolages | 0 |
| Vols / dégradations | 87 |
| Stupéfiants | 0 |
Achat / Vente / Location Votre agence immobilière à Épernon
| Prix moyen | 220 592 € | Prix moyen au m² | 2 405 € |
| Prix moyen | 126 990 € | Prix moyen au m² | 2 708 € |
Carte de la ville de Épernon

Commerce |
|
|---|---|
|
Hypermarché (12km) Rambouillet |
|
| Supermarché | 2 |
| Boulangerie | 4 |
| Boucherie | 1 |
|
Station-service (3km) Hanches |
|
| Banque | 8 |
| La poste | 1 |
| Coiffeur | 8 |
| Vétérinaire | 3 |
| Restaurant | 14 |
Santé |
|
|---|---|
| Médecin | 8 |
| Dentiste | 6 |
| Pharmacie | 3 |
Éducation |
|
|---|---|
| Maternelle | 2 |
| Primaire | 2 |
| Collège | 1 |
|
Lycée (8km) Maintenon |
|


NOUVEAU : Décharges sauvages, détritus, objets abandonnés, graffitis, nids-de-poule : Déclarer un incident à Épernon


 Emmanuel MACRON
 Jean-Luc MÉLENCHON
 Marine LE PEN
 Éric ZEMMOUR
 Valérie PÉCRESSE
 Yannick JADOT
 Nicolas DUPONT-AIGNAN
 Fabien ROUSSEL
 Jean LASSALLE
 Anne HIDALGO
 Philippe POUTOU
 Nathalie ARTHAUDEmmanuel MACRONMarine LE PEN
| Ville | Habitants | Superficie | Pop densité | Pop active | Taux chômage | Revenu moyen | Prix immobilier | Note globale |
|---|---|---|---|---|---|---|---|---|
| Statistiques Raizeux | 1 011 | 10 km² | 101 h/km² | 46% | 3.9% | 31 640 €/an | 2 522 €/m² | - |
| Statistiques Droue-sur-Drouette | 1 195 | 5 km² | 239 h/km² | 46.9% | 3.9% | 30 000 €/an | 2 295 €/m² | - |
| Statistiques Hanches | 2 683 | 16 km² | 168 h/km² | 50% | 3.5% | 27 330 €/an | 2 325 €/m² | 3.0 |
| Statistiques Saint-Hilarion | 977 | 14 km² | 70 h/km² | 50.6% | 3.9% | 28 930 €/an | 2 885 €/m² | 3.6 |
| Statistiques Hermeray | 941 | 18 km² | 52 h/km² | 46.4% | 3.8% | 31 520 €/an | 2 392 €/m² | - |
| Statistiques Fréhel | 1 608 | 19 km² | 85 h/km² | 33.6% | 4.2% | 24 130 €/an | 2 374 €/m² | 3.3 |
| Statistiques Saint-Martin-de-Nigelles | 1 575 | 12 km² | 131 h/km² | 48.8% | 4.8% | 28 920 €/an | 2 133 €/m² | 3.2 |
| Statistiques Émancé | 891 | 12 km² | 74 h/km² | 48.4% | 3% | 30 810 €/an | 2 984 €/m² | - |
| Statistiques Gas | 752 | 12 km² | 63 h/km² | 54.4% | 2.8% | 28 040 €/an | 1 902 €/m² | 2.4 |
| Statistiques Mittainville | 641 | 11 km² | 58 h/km² | 47% | 4.1% | 29 300 €/an | 2 228 €/m² | - |
| Statistiques Saint-Lucien | 262 | 9 km² | 29 h/km² | 50% | 2.3% | 32 260 €/an | 1 748 €/m² | - |
| Statistiques Gazeran | 1 288 | 26 km² | 50 h/km² | 45.7% | 3.3% | 33 010 €/an | 3 202 €/m² | 3.0 |
| Statistiques Houx | 749 | 6 km² | 125 h/km² | 51.7% | 2.9% | 27 360 €/an | 1 886 €/m² | 2.8 |
| Statistiques La Boissière-École | 754 | 25 km² | 30 h/km² | 51.5% | 3.4% | 27 710 €/an | 2 148 €/m² | - |
| Statistiques Orphin | 880 | 17 km² | 52 h/km² | 49.8% | 3.3% | 30 860 €/an | 2 171 €/m² | - |