


Signalement de photo
Merci ! Votre signalement est envoyé !
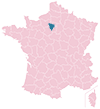
Quel est le nombre d'habitants à Ecquevilly ? Dans quel département et dans quelle région se situe la ville ? Quelle est sa superficie ?
Quels sont les chiffres de la délinquance ?
Découvrez sur cette page toutes les informations essentielles sur la population, la sécurité, les services et l'immobilier à Ecquevilly.
NOUVEAU : Rues sales, dépôts sauvages, dégradations urbaines. Faites votre signalement anonyme, nous nous chargeons de prévenir les autorités compétentes.
| Nombre d'habitants | 4 105 | Classement |
| Age moyen | 38 ans | Classement |
| Pop active | 49.7% | Classement |
| Taux chômage | 5.5% | Classement |
| Pop densité | 373 h/km² | Classement |
| Revenu moyen | 26 630 €/an | Classement |
| Agressions physiques / sexuelles | 40 |
| Cambriolages | 9 |
| Vols / dégradations | 58 |
| Stupéfiants | 5 |
Achat / Vente / Location Votre agence immobilière à Ecquevilly
| Prix moyen | 307 529 € | Prix moyen au m² | 3 355 € |
| Prix moyen | 166 674 € | Prix moyen au m² | 3 246 € |
Carte de la ville de Ecquevilly

Commerce |
|
|---|---|
|
Hypermarché (4km) Flins-sur-Seine |
|
| Supermarché | 1 |
| Boulangerie | 3 |
| Boucherie | 1 |
| Station-service | 1 |
| Banque | 2 |
| La poste | 1 |
| Coiffeur | 5 |
|
Vétérinaire (4km) Les Mureaux |
|
| Restaurant | 6 |
Santé |
|
|---|---|
| Médecin | 4 |
| Dentiste | 1 |
| Pharmacie | 1 |
Éducation |
|
|---|---|
| Maternelle | 2 |
| Primaire | 2 |
| Collège | 1 |
|
Lycée (4km) Les Mureaux |
|


NOUVEAU : Décharges sauvages, détritus, objets abandonnés, graffitis, nids-de-poule : Déclarer un incident à Ecquevilly


 Emmanuel MACRON
 Jean-Luc MÉLENCHON
 Marine LE PEN
 Éric ZEMMOUR
 Valérie PÉCRESSE
 Yannick JADOT
 Jean LASSALLE
 Nicolas DUPONT-AIGNAN
 Fabien ROUSSEL
 Anne HIDALGO
 Philippe POUTOU
 Nathalie ARTHAUDEmmanuel MACRONMarine LE PEN
| Ville | Habitants | Superficie | Pop densité | Pop active | Taux chômage | Revenu moyen | Prix immobilier | Note globale |
|---|---|---|---|---|---|---|---|---|
| Statistiques Chapet | 1 344 | 5 km² | 269 h/km² | 47.5% | 3.6% | 32 520 €/an | 3 063 €/m² | - |
| Statistiques Morainvilliers | 3 082 | 7 km² | 440 h/km² | 46.9% | 3.2% | 36 400 €/an | 3 281 €/m² | 1.2 |
| Statistiques Bouafle | 2 213 | 7 km² | 316 h/km² | 50.9% | 4.2% | 28 450 €/an | 3 604 €/m² | 4.4 |
| Statistiques Les Alluets-le-Roi | 1 273 | 7 km² | 182 h/km² | 43.3% | 3.2% | 34 380 €/an | 4 276 €/m² | - |
| Statistiques Flins-sur-Seine | 2 424 | 9 km² | 269 h/km² | 50.8% | 4.9% | 25 620 €/an | 3 094 €/m² | 3.8 |
| Statistiques Bazemont | 1 695 | 7 km² | 242 h/km² | 48% | 2.7% | 34 090 €/an | 2 940 €/m² | 4.3 |
| Statistiques Les Mureaux | 33 977 | 12 km² | 2 831 h/km² | 41.2% | 7.3% | 18 240 €/an | 2 132 €/m² | 3.6 |
| Statistiques Vernouillet | 10 025 | 6 km² | 1 671 h/km² | 48% | 6.2% | 28 980 €/an | 3 587 €/m² | 2.5 |
| Statistiques Aubergenville | 12 317 | 9 km² | 1 369 h/km² | 48.1% | 6.7% | 23 070 €/an | 2 601 €/m² | 3.7 |
| Statistiques Aulnay-sur-Mauldre | 1 137 | 2 km² | 569 h/km² | 51.5% | 4.3% | 28 930 €/an | 2 728 €/m² | 3.8 |
| Statistiques Hardricourt | 2 480 | 3 km² | 827 h/km² | 50.6% | 5.8% | 25 430 €/an | 2 883 €/m² | 4.0 |
| Statistiques Herbeville | 237 | 6 km² | 40 h/km² | 48.1% | 5.1% | 34 160 €/an | 3 467 €/m² | 4.4 |
| Statistiques Médan | 1 322 | 3 km² | 441 h/km² | 48.7% | 4.3% | 37 290 €/an | 3 889 €/m² | 4.2 |
| Statistiques Villennes-sur-Seine | 5 628 | 5 km² | 1 126 h/km² | 44.7% | 3.8% | 38 200 €/an | 4 588 €/m² | 4.1 |
| Statistiques Nézel | 1 083 | 1 km² | 1 083 h/km² | 48.8% | 4.8% | 27 320 €/an | 2 510 €/m² | 3.1 |