


Signalement de photo
Merci ! Votre signalement est envoyé !
Quel est le nombre d'habitants à Deluz ? Dans quel département et dans quelle région se situe la ville ? Quelle est sa superficie ?
Quels sont les chiffres de la délinquance ?
Découvrez sur cette page toutes les informations essentielles sur la population, la sécurité, les services et l'immobilier à Deluz.
NOUVEAU : Rues sales, dépôts sauvages, dégradations urbaines. Faites votre signalement anonyme, nous nous chargeons de prévenir les autorités compétentes.
| Nombre d'habitants | 623 | Classement |
| Age moyen | 44 ans | Classement |
| Pop active | 46.5% | Classement |
| Taux chômage | 3% | Classement |
| Pop densité | 78 h/km² | Classement |
| Revenu moyen | 22 170 €/an | Classement |
| Agressions physiques / sexuelles | 0 |
| Cambriolages | 0 |
| Vols / dégradations | 0 |
| Stupéfiants | 0 |
Achat / Vente / Location Votre agence immobilière à Deluz
| Prix moyen | 114 351 € | Prix moyen au m² | 1 204 € |
| Prix moyen | 64 940 € | Prix moyen au m² | 1 012 € |
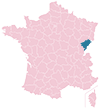
Carte de la ville de Deluz

Commerce |
|
|---|---|
|
Hypermarché (10km) Chalezeule |
|
|
Supermarché (5km) Marchaux-Chaudefontaine |
|
| Boulangerie | 1 |
|
Boucherie (3km) Laissey |
|
|
Station-service (5km) Marchaux-Chaudefontaine |
|
|
Banque (7km) Roche-lez-Beaupré |
|
|
La poste (7km) Roche-lez-Beaupré |
|
| Coiffeur | 1 |
|
Vétérinaire (7km) Roche-lez-Beaupré |
|
| Restaurant | 1 |


NOUVEAU : Décharges sauvages, détritus, objets abandonnés, graffitis, nids-de-poule : Déclarer un incident à Deluz


 Marine LE PEN
 Jean-Luc MÉLENCHON
 Emmanuel MACRON
 Éric ZEMMOUR
 Fabien ROUSSEL
 Jean LASSALLE
 Yannick JADOT
 Valérie PÉCRESSE
 Nicolas DUPONT-AIGNAN
 Philippe POUTOU
 Anne HIDALGO
 Nathalie ARTHAUDEmmanuel MACRONMarine LE PEN
| Ville | Habitants | Superficie | Pop densité | Pop active | Taux chômage | Revenu moyen | Prix immobilier | Note globale |
|---|---|---|---|---|---|---|---|---|
| Statistiques Laissey | 445 | 3 km² | 148 h/km² | 47.4% | 5.2% | 20 930 €/an | 964 €/m² | - |
| Statistiques Roulans | 1 125 | 8 km² | 141 h/km² | 45.9% | 2.7% | 24 240 €/an | 1 902 €/m² | - |
| Statistiques Pouligney-Lusans | 845 | 12 km² | 70 h/km² | 47.3% | 3.8% | 24 530 €/an | 1 877 €/m² | - |
| Statistiques Amagney | 941 | 13 km² | 72 h/km² | 45.1% | 3% | 24 290 €/an | 1 274 €/m² | - |
| Statistiques Osse | 356 | 8 km² | 45 h/km² | 48.9% | 4.2% | 24 500 €/an | 2 234 €/m² | - |
| Statistiques Vaire-Arcier | 800 | 14 km² | 57 h/km² | 46.3% | 4.4% | 24 790 €/an | 1 860 €/m² | - |
| Statistiques Champlive | 246 | 8 km² | 31 h/km² | 45.1% | 2.8% | 22 180 €/an | 697 €/m² | 3.2 |
| Statistiques Vennans | 253 | 1 km² | 253 h/km² | 54.5% | 2.4% | 24 170 €/an | 1 192 €/m² | - |
| Statistiques Châtillon-Guyotte | 140 | 4 km² | 35 h/km² | 61.4% | 4.3% | 25 180 €/an | NC | 3.2 |
| Statistiques Saint-Hilaire | 157 | 3 km² | 52 h/km² | 54.1% | 4.5% | 24 250 €/an | NC | - |
| Statistiques L'Écouvotte | 92 | 2 km² | 46 h/km² | 48.9% | 3.3% | 19 670 €/an | NC | - |
| Statistiques Novillars | 1 396 | 2 km² | 698 h/km² | 40.8% | 5.2% | 22 210 €/an | 2 200 €/m² | - |
| Statistiques Dammartin-les-Templiers | 195 | 10 km² | 20 h/km² | 47.2% | 5.1% | 24 340 €/an | 2 029 €/m² | - |
| Statistiques Marchaux-Chaudefontaine | 1 446 | 16 km² | 90 h/km² | 49% | 2.6% | 24 480 €/an | 1 823 €/m² | - |
| Statistiques Nancray | 1 286 | 16 km² | 80 h/km² | 47.3% | 2.2% | 25 240 €/an | 1 612 €/m² | - |