


Signalement de photo
Merci ! Votre signalement est envoyé !
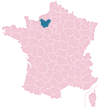
Quel est le nombre d'habitants à Croth ? Dans quel département et dans quelle région se situe la ville ? Quelle est sa superficie ?
Quels sont les chiffres de la délinquance ?
Découvrez sur cette page toutes les informations essentielles sur la population, la sécurité, les services et l'immobilier à Croth.
NOUVEAU : Rues sales, dépôts sauvages, dégradations urbaines. Faites votre signalement anonyme, nous nous chargeons de prévenir les autorités compétentes.
| Nombre d'habitants | 1 378 | Classement |
| Age moyen | 39 ans | Classement |
| Pop active | 49.6% | Classement |
| Taux chômage | 5% | Classement |
| Pop densité | 125 h/km² | Classement |
| Revenu moyen | 23 590 €/an | Classement |
| Agressions physiques / sexuelles | 0 |
| Cambriolages | 0 |
| Vols / dégradations | 0 |
| Stupéfiants | 0 |
Achat / Vente / Location Votre agence immobilière à Croth
| Prix moyen | 177 420 € | Prix moyen au m² | 1 878 € |
Carte de la ville de Croth

Commerce |
|
|---|---|
|
Hypermarché (5km) Anet |
|
|
Supermarché (4km) Saussay |
|
|
Boulangerie (2km) Marcilly-sur-Eure |
|
|
Boucherie (2km) Marcilly-sur-Eure |
|
|
Station-service (4km) Saussay |
|
|
Banque (5km) Ézy-sur-Eure |
|
|
La poste (0km) Sorel-Moussel |
|
| Coiffeur | 3 |
|
Vétérinaire (5km) Anet |
|
| Restaurant | 1 |
Santé |
|
|---|---|
| Médecin | 2 |
|
Dentiste (5km) Anet |
|
|
Pharmacie (2km) Marcilly-sur-Eure |
|
Éducation |
|
|---|---|
| Maternelle | 1 |
| Primaire | 1 |
|
Collège (5km) Ézy-sur-Eure |
|
|
Lycée (5km) Anet |
|


NOUVEAU : Décharges sauvages, détritus, objets abandonnés, graffitis, nids-de-poule : Déclarer un incident à Croth


 Marine LE PEN
 Emmanuel MACRON
 Jean-Luc MÉLENCHON
 Éric ZEMMOUR
 Nicolas DUPONT-AIGNAN
 Yannick JADOT
 Fabien ROUSSEL
 Valérie PÉCRESSE
 Jean LASSALLE
 Nathalie ARTHAUD
 Philippe POUTOU
 Anne HIDALGOEmmanuel MACRONMarine LE PEN
| Ville | Habitants | Superficie | Pop densité | Pop active | Taux chômage | Revenu moyen | Prix immobilier | Note globale |
|---|---|---|---|---|---|---|---|---|
| Statistiques Sorel-Moussel | 1 722 | 13 km² | 132 h/km² | 48.1% | 4.6% | 25 620 €/an | 2 182 €/m² | 3.1 |
| Statistiques Marcilly-sur-Eure | 1 588 | 15 km² | 106 h/km² | 47.4% | 4.8% | 25 340 €/an | 2 232 €/m² | 1.4 |
| Statistiques Saint-Georges-Motel | 879 | 5 km² | 176 h/km² | 44.8% | 4.9% | 25 480 €/an | 2 171 €/m² | - |
| Statistiques L'Habit | 496 | 5 km² | 99 h/km² | 50.2% | 4.2% | 27 250 €/an | 2 000 €/m² | - |
| Statistiques Bois-le-Roi | 1 231 | 5 km² | 246 h/km² | 47.2% | 4.3% | 24 320 €/an | 2 272 €/m² | - |
| Statistiques Saussay | 1 099 | 5 km² | 220 h/km² | 48.7% | 5.9% | 24 180 €/an | 1 997 €/m² | - |
| Statistiques Saint-Laurent-des-Bois | 245 | 3 km² | 82 h/km² | 49% | 5.3% | 24 350 €/an | 1 884 €/m² | - |
| Statistiques Louye | 219 | 5 km² | 44 h/km² | 47.9% | 3.7% | 25 670 €/an | 1 260 €/m² | - |
| Statistiques Ézy-sur-Eure | 3 669 | 9 km² | 408 h/km² | 47.2% | 5% | 22 490 €/an | 1 662 €/m² | 2.6 |
| Statistiques Anet | 2 696 | 8 km² | 337 h/km² | 41.5% | 4% | 24 220 €/an | 2 130 €/m² | 3.2 |
| Statistiques Champigny-la-Futelaye | 272 | 16 km² | 17 h/km² | 48.5% | 5.1% | 24 290 €/an | 2 215 €/m² | - |
| Statistiques Courdemanche | 596 | 9 km² | 66 h/km² | 48.7% | 3% | 25 540 €/an | 1 521 €/m² | - |
| Statistiques Lignerolles | 349 | 6 km² | 58 h/km² | 51.9% | 3.2% | 22 780 €/an | 1 883 €/m² | - |
| Statistiques Abondant | 2 427 | 35 km² | 69 h/km² | 49.1% | 3.8% | 26 810 €/an | 2 126 €/m² | 3.9 |
| Statistiques Montreuil | 522 | 6 km² | 87 h/km² | 45.6% | 3.6% | 25 680 €/an | 1 625 €/m² | 4.0 |