


Signalement de photo
Merci ! Votre signalement est envoyé !
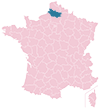
Quel est le nombre d'habitants à Chepy ? Dans quel département et dans quelle région se situe la ville ? Quelle est sa superficie ?
Quels sont les chiffres de la délinquance ?
Découvrez sur cette page toutes les informations essentielles sur la population, la sécurité, les services et l'immobilier à Chepy.
NOUVEAU : Rues sales, dépôts sauvages, dégradations urbaines. Faites votre signalement anonyme, nous nous chargeons de prévenir les autorités compétentes.
| Nombre d'habitants | 1 235 | Classement |
| Age moyen | 42 ans | Classement |
| Pop active | 42.8% | Classement |
| Taux chômage | 7.6% | Classement |
| Pop densité | 176 h/km² | Classement |
| Revenu moyen | 20 290 €/an | Classement |
| Agressions physiques / sexuelles | 0 |
| Cambriolages | 0 |
| Vols / dégradations | 10 |
| Stupéfiants | 0 |
Achat / Vente / Location Votre agence immobilière à Chepy
| Prix moyen | 79 669 € | Prix moyen au m² | 917 € |
| Prix moyen | 79 000 € | Prix moyen au m² | 1 162 € |
Carte de la ville de Chepy

Commerce |
|
|---|---|
|
Hypermarché (7km) Friville-Escarbotin |
|
|
Supermarché (4km) Feuquières-en-Vimeu |
|
| Boulangerie | 1 |
| Boucherie | 1 |
|
Station-service (4km) Feuquières-en-Vimeu |
|
|
Banque (4km) Feuquières-en-Vimeu |
|
|
La poste (4km) Feuquières-en-Vimeu |
|
| Coiffeur | 5 |
|
Vétérinaire (4km) Feuquières-en-Vimeu |
|
| Restaurant | 1 |
Santé |
|
|---|---|
| Médecin | 1 |
|
Dentiste (4km) Feuquières-en-Vimeu |
|
| Pharmacie | 1 |
Éducation |
|
|---|---|
| Maternelle | 1 |
| Primaire | 1 |
|
Collège (4km) Feuquières-en-Vimeu |
|
|
Lycée (7km) Friville-Escarbotin |
|


NOUVEAU : Décharges sauvages, détritus, objets abandonnés, graffitis, nids-de-poule : Déclarer un incident à Chepy


 Marine LE PEN
 Emmanuel MACRON
 Jean-Luc MÉLENCHON
 Éric ZEMMOUR
 Valérie PÉCRESSE
 Fabien ROUSSEL
 Anne HIDALGO
 Jean LASSALLE
 Nicolas DUPONT-AIGNAN
 Nathalie ARTHAUD
 Yannick JADOT
 Philippe POUTOUEmmanuel MACRONMarine LE PEN
| Ville | Habitants | Superficie | Pop densité | Pop active | Taux chômage | Revenu moyen | Prix immobilier | Note globale |
|---|---|---|---|---|---|---|---|---|
| Statistiques Acheux-en-Vimeu | 499 | 12 km² | 42 h/km² | 45.9% | 3.8% | 21 710 €/an | 1 274 €/m² | - |
| Statistiques Valines | 621 | 5 km² | 124 h/km² | 44.3% | 6.8% | 22 480 €/an | 1 093 €/m² | 1.8 |
| Statistiques Feuquières-en-Vimeu | 2 454 | 8 km² | 307 h/km² | 44.6% | 6.9% | 20 140 €/an | 1 354 €/m² | 3.8 |
| Statistiques Franleu | 512 | 8 km² | 64 h/km² | 49.2% | 4.1% | 21 390 €/an | 1 206 €/m² | - |
| Statistiques Ochancourt | 325 | 4 km² | 81 h/km² | 47.7% | 2.5% | 21 610 €/an | 1 503 €/m² | - |
| Statistiques Aigneville | 901 | 11 km² | 82 h/km² | 49.7% | 4.7% | 20 750 €/an | 1 148 €/m² | - |
| Statistiques Tours-en-Vimeu | 806 | 13 km² | 62 h/km² | 45% | 2.9% | 21 620 €/an | 1 085 €/m² | 2.8 |
| Statistiques Toeufles | 301 | 9 km² | 33 h/km² | 49.8% | 3.3% | 22 320 €/an | 1 200 €/m² | - |
| Statistiques Ercourt | 121 | 4 km² | 30 h/km² | 52.9% | 4.1% | 20 500 €/an | 1 611 €/m² | - |
| Statistiques Vismes | 476 | 13 km² | 37 h/km² | 50.2% | 3.8% | 22 500 €/an | 1 565 €/m² | - |
| Statistiques Fressenneville | 2 127 | 9 km² | 236 h/km² | 45.1% | 7.9% | 20 370 €/an | 1 240 €/m² | - |
| Statistiques Nibas | 836 | 13 km² | 64 h/km² | 46.1% | 2.8% | 22 040 €/an | 1 425 €/m² | - |
| Statistiques Miannay | 600 | 9 km² | 67 h/km² | 46.5% | 3.8% | 23 320 €/an | 1 327 €/m² | - |
| Statistiques Grébault-Mesnil | 207 | 3 km² | 69 h/km² | 53.6% | 4.8% | 20 250 €/an | 1 307 €/m² | - |
| Statistiques Quesnoy-le-Montant | 533 | 7 km² | 76 h/km² | 49.5% | 6.8% | 23 490 €/an | 1 310 €/m² | - |