


Signalement de photo
Merci ! Votre signalement est envoyé !
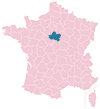
Quel est le nombre d'habitants à Chécy ? Dans quel département et dans quelle région se situe la ville ? Quelle est sa superficie ?
Quels sont les chiffres de la délinquance ?
Découvrez sur cette page toutes les informations essentielles sur la population, la sécurité, les services et l'immobilier à Chécy.
NOUVEAU : Rues sales, dépôts sauvages, dégradations urbaines. Faites votre signalement anonyme, nous nous chargeons de prévenir les autorités compétentes.
| Nombre d'habitants | 8 808 | Classement |
| Age moyen | 42 ans | Classement |
| Pop active | 45.1% | Classement |
| Taux chômage | 4% | Classement |
| Pop densité | 587 h/km² | Classement |
| Revenu moyen | 25 770 €/an | Classement |
| Agressions physiques / sexuelles | 50 |
| Cambriolages | 24 |
| Vols / dégradations | 101 |
| Stupéfiants | 14 |
Achat / Vente / Location Votre agence immobilière à Chécy
| Prix moyen | 205 579 € | Prix moyen au m² | 2 009 € |
| Prix moyen | 104 686 € | Prix moyen au m² | 1 901 € |
Carte de la ville de Chécy

Commerce |
|
|---|---|
| Hypermarché | 1 |
|
Supermarché (4km) Boigny-sur-Bionne |
|
| Boulangerie | 3 |
| Boucherie | 1 |
| Station-service | 2 |
| Banque | 7 |
| La poste | 1 |
| Coiffeur | 12 |
| Vétérinaire | 4 |
| Restaurant | 17 |
Santé |
|
|---|---|
| Médecin | 15 |
| Dentiste | 4 |
| Pharmacie | 4 |
Éducation |
|
|---|---|
| Maternelle | 3 |
| Primaire | 3 |
| Collège | 1 |
|
Lycée (4km) Saint-Jean-de-Braye |
|


NOUVEAU : Décharges sauvages, détritus, objets abandonnés, graffitis, nids-de-poule : Déclarer un incident à Chécy


 Emmanuel MACRON
 Marine LE PEN
 Jean-Luc MÉLENCHON
 Yannick JADOT
 Éric ZEMMOUR
 Valérie PÉCRESSE
 Nicolas DUPONT-AIGNAN
 Jean LASSALLE
 Fabien ROUSSEL
 Anne HIDALGO
 Nathalie ARTHAUD
 Philippe POUTOUEmmanuel MACRONMarine LE PEN
| Ville | Habitants | Superficie | Pop densité | Pop active | Taux chômage | Revenu moyen | Prix immobilier | Note globale |
|---|---|---|---|---|---|---|---|---|
| Statistiques Combleux | 500 | 1 km² | 500 h/km² | 43.2% | 1.8% | 33 190 €/an | 2 108 €/m² | - |
| Statistiques Mardié | 3 011 | 17 km² | 177 h/km² | 48.2% | 3.6% | 26 450 €/an | 2 147 €/m² | 1.2 |
| Statistiques Boigny-sur-Bionne | 2 094 | 8 km² | 262 h/km² | 47.2% | 4% | 26 860 €/an | 1 937 €/m² | - |
| Statistiques Saint-Jean-de-Braye | 21 700 | 14 km² | 1 550 h/km² | 47% | 6.2% | 22 100 €/an | 1 941 €/m² | 3.2 |
| Statistiques Bou | 1 011 | 6 km² | 169 h/km² | 50.6% | 2.7% | 27 720 €/an | 1 872 €/m² | 4.0 |
| Statistiques Saint-Denis-en-Val | 7 654 | 17 km² | 450 h/km² | 44.6% | 3.7% | 27 310 €/an | 2 437 €/m² | 4.1 |
| Statistiques Marigny-les-Usages | 1 818 | 10 km² | 182 h/km² | 48.9% | 2.1% | 27 110 €/an | 2 138 €/m² | - |
| Statistiques Sandillon | 4 205 | 41 km² | 103 h/km² | 48.1% | 2.3% | 27 180 €/an | 2 098 €/m² | 3.1 |
| Statistiques Vennecy | 2 043 | 11 km² | 186 h/km² | 51.4% | 2.3% | 26 570 €/an | 1 845 €/m² | 3.7 |
| Statistiques Semoy | 3 211 | 8 km² | 401 h/km² | 45.4% | 3.1% | 26 890 €/an | 2 141 €/m² | 3.3 |
| Statistiques Donnery | 2 843 | 22 km² | 129 h/km² | 48.1% | 2.3% | 27 290 €/an | 1 810 €/m² | - |
| Statistiques Darvoy | 1 880 | 9 km² | 209 h/km² | 47% | 2.9% | 25 590 €/an | 2 029 €/m² | 3.1 |
| Statistiques Saint-Jean-le-Blanc | 9 379 | 8 km² | 1 172 h/km² | 45.3% | 3.6% | 26 090 €/an | 2 039 €/m² | 3.8 |
| Statistiques Chanteau | 1 631 | 29 km² | 56 h/km² | 52.5% | 3.6% | 26 530 €/an | 1 845 €/m² | 2.6 |
| Statistiques Saint-Cyr-en-Val | 3 392 | 44 km² | 77 h/km² | 42.7% | 2.9% | 27 790 €/an | 2 292 €/m² | 3.9 |