


Signalement de photo
Merci ! Votre signalement est envoyé !
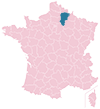
Quel est le nombre d'habitants à Chaudun ? Dans quel département et dans quelle région se situe la ville ? Quelle est sa superficie ?
Quels sont les chiffres de la délinquance ?
Découvrez sur cette page toutes les informations essentielles sur la population, la sécurité, les services et l'immobilier à Chaudun.
NOUVEAU : Rues sales, dépôts sauvages, dégradations urbaines. Faites votre signalement anonyme, nous nous chargeons de prévenir les autorités compétentes.
| Nombre d'habitants | 251 | Classement |
| Age moyen | 38 ans | Classement |
| Pop active | 55.4% | Classement |
| Taux chômage | 6.8% | Classement |
| Pop densité | 28 h/km² | Classement |
| Revenu moyen | 24 190 €/an | Classement |
| Agressions physiques / sexuelles | 0 |
| Cambriolages | 0 |
| Vols / dégradations | 0 |
| Stupéfiants | 0 |
Achat / Vente / Location Votre agence immobilière à Chaudun
| Prix moyen | 132 018 € | Prix moyen au m² | 1 457 € |
| Prix moyen | 150 500 € | Prix moyen au m² | 1 505 € |
Carte de la ville de Chaudun

Commerce |
|
|---|---|
|
Hypermarché (7km) Soissons |
|
|
Supermarché (7km) Soissons |
|
|
Boulangerie (4km) Berzy-le-Sec |
|
|
Boucherie (6km) Vauxbuin |
|
|
Station-service (6km) Vauxbuin |
|
|
Banque (7km) Soissons |
|
|
La poste (7km) Belleu |
|
|
Coiffeur (5km) Villemontoire |
|
|
Vétérinaire (7km) Soissons |
|
|
Restaurant (4km) Dommiers |
|
Santé |
|
|---|---|
|
Médecin (7km) Belleu |
|
|
Dentiste (7km) Belleu |
|
|
Pharmacie (5km) Courmelles |
|
Éducation |
|
|---|---|
|
Maternelle (5km) Noyant-et-Aconin |
|
|
Primaire (5km) Noyant-et-Aconin |
|
|
Collège (7km) Soissons |
|
|
Lycée (7km) Soissons |
|


NOUVEAU : Décharges sauvages, détritus, objets abandonnés, graffitis, nids-de-poule : Déclarer un incident à Chaudun


 Marine LE PEN
 Emmanuel MACRON
 Jean-Luc MÉLENCHON
 Valérie PÉCRESSE
 Jean LASSALLE
 Éric ZEMMOUR
 Yannick JADOT
 Anne HIDALGO
 Nicolas DUPONT-AIGNAN
 Nathalie ARTHAUD
 Fabien ROUSSEL
 Philippe POUTOUEmmanuel MACRONMarine LE PEN
| Ville | Habitants | Superficie | Pop densité | Pop active | Taux chômage | Revenu moyen | Prix immobilier | Note globale |
|---|---|---|---|---|---|---|---|---|
| Statistiques Missy-aux-Bois | 97 | 3 km² | 32 h/km² | 50.5% | 6.2% | 30 210 €/an | 1 364 €/m² | - |
| Statistiques Ploisy | 91 | 3 km² | 30 h/km² | 46.2% | 5.5% | NC | 1 390 €/m² | 3.6 |
| Statistiques Vierzy | 395 | 13 km² | 30 h/km² | 51.1% | 8.1% | 21 250 €/an | 1 245 €/m² | - |
| Statistiques Berzy-le-Sec | 379 | 12 km² | 32 h/km² | 50.1% | 6.6% | 23 260 €/an | 1 705 €/m² | - |
| Statistiques Dommiers | 301 | 7 km² | 43 h/km² | 49.2% | 4% | 23 120 €/an | 1 605 €/m² | - |
| Statistiques Noyant-et-Aconin | 495 | 5 km² | 99 h/km² | 46.7% | 7.1% | 22 260 €/an | 1 667 €/m² | - |
| Statistiques Villemontoire | 200 | 8 km² | 25 h/km² | 46% | 3.5% | 23 690 €/an | 1 157 €/m² | - |
| Statistiques Courmelles | 1 854 | 7 km² | 265 h/km² | 43.6% | 6.3% | 22 730 €/an | 1 618 €/m² | 2.8 |
| Statistiques Villers-Hélon | 199 | 8 km² | 25 h/km² | 49.7% | 3.5% | 24 660 €/an | 1 526 €/m² | - |
| Statistiques Saconin-et-Breuil | 197 | 9 km² | 22 h/km² | 48.2% | 6.6% | 26 620 €/an | 1 813 €/m² | - |
| Statistiques Buzancy | 192 | 5 km² | 38 h/km² | 45.8% | 6.8% | 25 330 €/an | 1 568 €/m² | - |
| Statistiques Saint-Pierre-Aigle | 336 | 12 km² | 28 h/km² | 46.7% | 5.1% | 25 610 €/an | 1 505 €/m² | - |
| Statistiques Vauxbuin | 778 | 5 km² | 156 h/km² | 41.8% | 3.9% | 24 970 €/an | 1 611 €/m² | - |
| Statistiques Septmonts | 567 | 5 km² | 113 h/km² | 46% | 3.7% | 24 140 €/an | 1 655 €/m² | - |
| Statistiques Rozières-sur-Crise | 230 | 7 km² | 33 h/km² | 43.5% | 6.5% | 24 220 €/an | 1 439 €/m² | - |