


Signalement de photo
Merci ! Votre signalement est envoyé !
Quel est le nombre d'habitants à Châtel-Guyon ? Dans quel département et dans quelle région se situe la ville ? Quelle est sa superficie ?
Quels sont les chiffres de la délinquance ?
Découvrez sur cette page toutes les informations essentielles sur la population, la sécurité, les services et l'immobilier à Châtel-Guyon.
NOUVEAU : Rues sales, dépôts sauvages, dégradations urbaines. Faites votre signalement anonyme, nous nous chargeons de prévenir les autorités compétentes.
| Nombre d'habitants | 6 294 | Classement |
| Age moyen | 45 ans | Classement |
| Pop active | 45.3% | Classement |
| Taux chômage | 4.2% | Classement |
| Pop densité | 450 h/km² | Classement |
| Revenu moyen | 25 780 €/an | Classement |
| Agressions physiques / sexuelles | 30 |
| Cambriolages | 31 |
| Vols / dégradations | 97 |
| Stupéfiants | 0 |
Achat / Vente / Location Votre agence immobilière à Châtel-Guyon
| Prix moyen | 186 156 € | Prix moyen au m² | 1 984 € |
| Prix moyen | 99 572 € | Prix moyen au m² | 2 283 € |
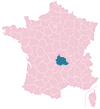
Carte de la ville de Châtel-Guyon

Commerce |
|
|---|---|
|
Hypermarché (2km) Enval |
|
| Supermarché | 1 |
| Boulangerie | 6 |
| Boucherie | 2 |
| Station-service | 2 |
| Banque | 2 |
| La poste | 1 |
| Coiffeur | 14 |
| Vétérinaire | 1 |
| Restaurant | 19 |
Santé |
|
|---|---|
| Médecin | 14 |
| Dentiste | 3 |
| Pharmacie | 3 |
Éducation |
|
|---|---|
| Maternelle | 3 |
| Primaire | 3 |
| Collège | 1 |
|
Lycée (4km) Riom |
|


NOUVEAU : Décharges sauvages, détritus, objets abandonnés, graffitis, nids-de-poule : Déclarer un incident à Châtel-Guyon


 Emmanuel MACRON
 Marine LE PEN
 Jean-Luc MÉLENCHON
 Valérie PÉCRESSE
 Éric ZEMMOUR
 Yannick JADOT
 Jean LASSALLE
 Nicolas DUPONT-AIGNAN
 Anne HIDALGO
 Fabien ROUSSEL
 Philippe POUTOU
 Nathalie ARTHAUDEmmanuel MACRONMarine LE PEN
| Ville | Habitants | Superficie | Pop densité | Pop active | Taux chômage | Revenu moyen | Prix immobilier | Note globale |
|---|---|---|---|---|---|---|---|---|
| Statistiques Yssac-la-Tourette | 397 | 2 km² | 199 h/km² | 54.7% | 3.8% | 25 860 €/an | 2 191 €/m² | - |
| Statistiques Enval | 1 569 | 5 km² | 314 h/km² | 45.7% | 2.7% | 26 740 €/an | 1 899 €/m² | - |
| Statistiques Saint-Bonnet-près-Riom | 2 072 | 7 km² | 296 h/km² | 48.5% | 3.3% | 26 260 €/an | 1 784 €/m² | 4.0 |
| Statistiques Teilhède | 501 | 12 km² | 42 h/km² | 48.7% | 4% | 25 160 €/an | 1 913 €/m² | - |
| Statistiques Prompsat | 464 | 4 km² | 116 h/km² | 48.3% | 2.4% | 26 240 €/an | 1 486 €/m² | - |
| Statistiques Gimeaux | 393 | 2 km² | 197 h/km² | 46.8% | 3.8% | 24 760 €/an | 1 494 €/m² | - |
| Statistiques Marsat | 1 479 | 4 km² | 370 h/km² | 44.5% | 2.9% | 31 560 €/an | 1 943 €/m² | 2.2 |
| Statistiques Loubeyrat | 1 424 | 24 km² | 59 h/km² | 48.2% | 3.2% | 25 440 €/an | 1 773 €/m² | - |
| Statistiques Riom | 18 736 | 32 km² | 586 h/km² | 44.6% | 5.7% | 23 090 €/an | 1 868 €/m² | 3.6 |
| Statistiques Mozac | 3 863 | 4 km² | 966 h/km² | 43.8% | 3.5% | 26 150 €/an | 1 937 €/m² | 3.6 |
| Statistiques Charbonnières-les-Varennes | 1 874 | 32 km² | 59 h/km² | 50.5% | 3.3% | 25 130 €/an | 1 513 €/m² | - |
| Statistiques Davayat | 626 | 2 km² | 313 h/km² | 48.2% | 3% | 25 400 €/an | 1 911 €/m² | - |
| Statistiques Volvic | 4 740 | 28 km² | 169 h/km² | 46% | 4.5% | 24 990 €/an | 1 708 €/m² | 3.9 |
| Statistiques Beauregard-Vendon | 1 298 | 7 km² | 185 h/km² | 49.6% | 2.4% | 25 630 €/an | 1 904 €/m² | 5.0 |
| Statistiques Pessat-Villeneuve | 731 | 6 km² | 122 h/km² | 51.4% | 3.8% | 28 060 €/an | 2 026 €/m² | 2.8 |