


Signalement de photo
Merci ! Votre signalement est envoyé !
Quel est le nombre d'habitants à Chambœuf ? Dans quel département et dans quelle région se situe la ville ? Quelle est sa superficie ?
Quels sont les chiffres de la délinquance ?
Découvrez sur cette page toutes les informations essentielles sur la population, la sécurité, les services et l'immobilier à Chambœuf.
NOUVEAU : Rues sales, dépôts sauvages, dégradations urbaines. Faites votre signalement anonyme, nous nous chargeons de prévenir les autorités compétentes.
| Nombre d'habitants | 1 797 | Classement |
| Age moyen | 41 ans | Classement |
| Pop active | 48.7% | Classement |
| Taux chômage | 2.1% | Classement |
| Pop densité | 163 h/km² | Classement |
| Revenu moyen | 27 920 €/an | Classement |
| Agressions physiques / sexuelles | 0 |
| Cambriolages | 0 |
| Vols / dégradations | 0 |
| Stupéfiants | 0 |
Achat / Vente / Location Votre agence immobilière à Chambœuf
| Prix moyen | 204 183 € | Prix moyen au m² | 1 716 € |
| Prix moyen | 176 667 € | Prix moyen au m² | 2 752 € |
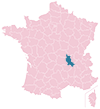
Carte de la ville de Chambœuf

Commerce |
|
|---|---|
|
Hypermarché (8km) Andrézieux-Bouthéon |
|
| Supermarché | 1 |
| Boulangerie | 1 |
|
Boucherie (0km) Saint-Galmier |
|
| Station-service | 1 |
| Banque | 1 |
|
La poste (0km) Saint-Galmier |
|
| Coiffeur | 1 |
|
Vétérinaire (0km) Saint-Galmier |
|
| Restaurant | 2 |
Santé |
|
|---|---|
| Médecin | 3 |
|
Dentiste (0km) Saint-Galmier |
|
|
Pharmacie (0km) Saint-Galmier |
|
Éducation |
|
|---|---|
| Maternelle | 1 |
| Primaire | 1 |
|
Collège (0km) Saint-Galmier |
|
|
Lycée (8km) Chazelles-sur-Lyon |
|


NOUVEAU : Décharges sauvages, détritus, objets abandonnés, graffitis, nids-de-poule : Déclarer un incident à Chambœuf


 Emmanuel MACRON
 Marine LE PEN
 Jean-Luc MÉLENCHON
 Éric ZEMMOUR
 Valérie PÉCRESSE
 Yannick JADOT
 Nicolas DUPONT-AIGNAN
 Anne HIDALGO
 Jean LASSALLE
 Fabien ROUSSEL
 Nathalie ARTHAUD
 Philippe POUTOUEmmanuel MACRONMarine LE PEN
| Ville | Habitants | Superficie | Pop densité | Pop active | Taux chômage | Revenu moyen | Prix immobilier | Note globale |
|---|---|---|---|---|---|---|---|---|
| Statistiques Saint-Galmier | 5 842 | 19 km² | 307 h/km² | 46.4% | 2.5% | 26 680 €/an | 2 116 €/m² | 3.0 |
| Statistiques Saint-Bonnet-les-Oules | 1 768 | 12 km² | 147 h/km² | 46.8% | 1.8% | 31 840 €/an | 2 481 €/m² | 4.6 |
| Statistiques Veauchette | 1 202 | 8 km² | 150 h/km² | 49.7% | 2.7% | 25 070 €/an | 2 230 €/m² | 2.8 |
| Statistiques Saint-Médard-en-Forez | 961 | 10 km² | 96 h/km² | 47.8% | 3.7% | 25 220 €/an | 1 772 €/m² | 3.6 |
| Statistiques Veauche | 8 992 | 10 km² | 899 h/km² | 45.4% | 3.5% | 24 910 €/an | 2 263 €/m² | 4.1 |
| Statistiques Rivas | 724 | 5 km² | 145 h/km² | 47% | 2.9% | 28 270 €/an | 2 314 €/m² | - |
| Statistiques Cuzieu | 1 523 | 12 km² | 127 h/km² | 52.1% | 3.8% | 25 290 €/an | 2 052 €/m² | 3.8 |
| Statistiques Aveizieux | 1 686 | 9 km² | 187 h/km² | 52.3% | 3.6% | 25 590 €/an | 2 470 €/m² | - |
| Statistiques Chevrières | 1 160 | 15 km² | 77 h/km² | 50.9% | 2.2% | 23 420 €/an | 1 740 €/m² | - |
| Statistiques Craintilleux | 1 349 | 8 km² | 169 h/km² | 51.1% | 2.6% | 25 200 €/an | 1 830 €/m² | 4.3 |
| Statistiques Bellegarde-en-Forez | 1 991 | 19 km² | 105 h/km² | 48.1% | 2.5% | 23 510 €/an | 1 631 €/m² | 3.1 |
| Statistiques Chazelles-sur-Lyon | 5 472 | 21 km² | 261 h/km² | 45.2% | 4.4% | 21 810 €/an | 1 557 €/m² | 3.6 |
| Statistiques Andrézieux-Bouthéon | 10 187 | 16 km² | 637 h/km² | 41.9% | 4.9% | 22 200 €/an | 1 940 €/m² | 4.5 |
| Statistiques Maringes | 675 | 9 km² | 75 h/km² | 49.2% | 1.8% | 22 430 €/an | 1 272 €/m² | - |
| Statistiques Unias | 430 | 5 km² | 86 h/km² | 48.1% | 2.1% | 24 630 €/an | 2 206 €/m² | - |