


Signalement de photo
Merci ! Votre signalement est envoyé !
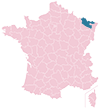
Quel est le nombre d'habitants à Carling ? Dans quel département et dans quelle région se situe la ville ? Quelle est sa superficie ?
Quels sont les chiffres de la délinquance ?
Découvrez sur cette page toutes les informations essentielles sur la population, la sécurité, les services et l'immobilier à Carling.
NOUVEAU : Rues sales, dépôts sauvages, dégradations urbaines. Faites votre signalement anonyme, nous nous chargeons de prévenir les autorités compétentes.
| Nombre d'habitants | 3 373 | Classement |
| Age moyen | 44 ans | Classement |
| Pop active | 43.6% | Classement |
| Taux chômage | 6.6% | Classement |
| Pop densité | 1 124 h/km² | Classement |
| Revenu moyen | 20 940 €/an | Classement |
| Agressions physiques / sexuelles | 27 |
| Cambriolages | 0 |
| Vols / dégradations | 17 |
| Stupéfiants | 0 |
Achat / Vente / Location Votre agence immobilière à Carling
| Prix moyen | 0 € | Prix moyen au m² | 0 € |
Carte de la ville de Carling
Commerce |
|
|---|---|
|
Hypermarché (5km) Creutzwald |
|
| Supermarché | 1 |
| Boulangerie | 3 |
|
Boucherie (1km) L'Hôpital |
|
|
Station-service (5km) Creutzwald |
|
| Banque | 1 |
| La poste | 1 |
| Coiffeur | 4 |
| Vétérinaire | 1 |
| Restaurant | 7 |
Santé |
|
|---|---|
| Médecin | 2 |
| Dentiste | 1 |
| Pharmacie | 1 |
Éducation |
|
|---|---|
| Maternelle | 2 |
| Primaire | 1 |
|
Collège (1km) L'Hôpital |
|
|
Lycée (5km) Creutzwald |
|


NOUVEAU : Décharges sauvages, détritus, objets abandonnés, graffitis, nids-de-poule : Déclarer un incident à Carling


 Marine LE PEN
 Emmanuel MACRON
 Jean-Luc MÉLENCHON
 Éric ZEMMOUR
 Jean LASSALLE
 Valérie PÉCRESSE
 Fabien ROUSSEL
 Nicolas DUPONT-AIGNAN
 Yannick JADOT
 Philippe POUTOU
 Anne HIDALGO
 Nathalie ARTHAUDEmmanuel MACRONMarine LE PEN
| Ville | Habitants | Superficie | Pop densité | Pop active | Taux chômage | Revenu moyen | Prix immobilier | Note globale |
|---|---|---|---|---|---|---|---|---|
| Statistiques L'Hôpital | 5 182 | 4 km² | 1 296 h/km² | 43.1% | 8.3% | 20 080 €/an | NC | 2.3 |
| Statistiques Diesen | 1 043 | 5 km² | 209 h/km² | 40.9% | 4.2% | 22 760 €/an | NC | - |
| Statistiques Creutzwald | 12 514 | 27 km² | 463 h/km² | 42.4% | 7.5% | 19 470 €/an | NC | - |
| Statistiques Porcelette | 2 472 | 13 km² | 190 h/km² | 45.7% | 3.1% | 25 030 €/an | NC | 2.6 |
| Statistiques Hombourg-Haut | 6 267 | 12 km² | 522 h/km² | 37% | 7.6% | 19 130 €/an | NC | 3.3 |
| Statistiques Varsberg | 970 | 4 km² | 243 h/km² | 48.4% | 4.9% | 24 650 €/an | NC | - |
| Statistiques Ham-sous-Varsberg | 2 875 | 7 km² | 411 h/km² | 43.7% | 4.9% | 22 820 €/an | NC | 3.6 |
| Statistiques Freyming-Merlebach | 13 027 | 9 km² | 1 447 h/km² | 37.1% | 7.5% | 18 530 €/an | NC | 2.8 |
| Statistiques Guerting | 866 | 6 km² | 144 h/km² | 46.7% | 4.5% | 24 530 €/an | NC | - |
| Statistiques Saint-Avold | 15 045 | 35 km² | 430 h/km² | 42.8% | 7% | 20 940 €/an | NC | 4.1 |
| Statistiques Longeville-lès-Saint-Avold | 3 611 | 25 km² | 144 h/km² | 47.9% | 5.3% | 23 860 €/an | NC | - |
| Statistiques Macheren | 2 802 | 17 km² | 165 h/km² | 42.5% | 4.5% | 23 900 €/an | NC | - |
| Statistiques Bisten-en-Lorraine | 253 | 4 km² | 63 h/km² | 47% | 4.7% | 24 010 €/an | NC | 2.6 |
| Statistiques Boucheporn | 570 | 7 km² | 81 h/km² | 49.6% | 3.7% | 24 590 €/an | NC | - |
| Statistiques Betting | 861 | 4 km² | 215 h/km² | 45.4% | 6.4% | 24 260 €/an | NC | 4.7 |