


Signalement de photo
Merci ! Votre signalement est envoyé !
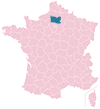
Quel est le nombre d'habitants à Formerie ? Dans quel département et dans quelle région se situe la ville ? Quelle est sa superficie ?
Quels sont les chiffres de la délinquance ?
Découvrez sur cette page toutes les informations essentielles sur la population, la sécurité, les services et l'immobilier à Formerie.
NOUVEAU : Rues sales, dépôts sauvages, dégradations urbaines. Faites votre signalement anonyme, nous nous chargeons de prévenir les autorités compétentes.
| Nombre d'habitants | 2 105 | Classement |
| Age moyen | 45 ans | Classement |
| Pop active | 39.3% | Classement |
| Taux chômage | 6.7% | Classement |
| Pop densité | 162 h/km² | Classement |
| Revenu moyen | 19 260 €/an | Classement |
| Agressions physiques / sexuelles | 0 |
| Cambriolages | 0 |
| Vols / dégradations | 36 |
| Stupéfiants | 0 |
Achat / Vente / Location Votre agence immobilière à Formerie
| Prix moyen | 116 284 € | Prix moyen au m² | 1 285 € |
| Prix moyen | 36 727 € | Prix moyen au m² | 766 € |
Carte de la ville de Formerie

Commerce |
|
|---|---|
|
Hypermarché (13km) Serqueux |
|
| Supermarché | 2 |
| Boulangerie | 3 |
| Boucherie | 3 |
| Station-service | 2 |
| Banque | 3 |
| La poste | 1 |
| Coiffeur | 4 |
| Vétérinaire | 4 |
| Restaurant | 6 |
Santé |
|
|---|---|
| Médecin | 5 |
| Dentiste | 7 |
| Pharmacie | 2 |
Éducation |
|
|---|---|
| Maternelle | 1 |
| Primaire | 1 |
| Collège | 1 |
|
Lycée (14km) Forges-les-Eaux |
|


NOUVEAU : Décharges sauvages, détritus, objets abandonnés, graffitis, nids-de-poule : Déclarer un incident à Formerie


 Marine LE PEN
 Emmanuel MACRON
 Jean-Luc MÉLENCHON
 Éric ZEMMOUR
 Valérie PÉCRESSE
 Fabien ROUSSEL
 Nicolas DUPONT-AIGNAN
 Jean LASSALLE
 Nathalie ARTHAUD
 Yannick JADOT
 Anne HIDALGO
 Philippe POUTOUEmmanuel MACRONMarine LE PEN
| Ville | Habitants | Superficie | Pop densité | Pop active | Taux chômage | Revenu moyen | Prix immobilier | Note globale |
|---|---|---|---|---|---|---|---|---|
| Statistiques Bouvresse | 164 | 3 km² | 55 h/km² | 49.4% | 0.6% | 24 640 €/an | 1 231 €/m² | - |
| Statistiques Blargies | 511 | 10 km² | 51 h/km² | 47.6% | 4.7% | 20 900 €/an | 1 410 €/m² | - |
| Statistiques Monceaux-l'Abbaye | 216 | 5 km² | 43 h/km² | 44% | 2.8% | 20 420 €/an | 921 €/m² | - |
| Statistiques Campeaux | 487 | 11 km² | 44 h/km² | 47.6% | 6.2% | 20 940 €/an | 1 349 €/m² | - |
| Statistiques Mureaumont | 146 | 5 km² | 29 h/km² | 52.7% | 4.8% | 21 140 €/an | 1 353 €/m² | - |
| Statistiques Criquiers | 711 | 24 km² | 30 h/km² | 46.3% | 4.1% | 20 720 €/an | 1 169 €/m² | 1.8 |
| Statistiques Haucourt | 189 | 10 km² | 19 h/km² | 49.7% | 9.5% | 19 750 €/an | 909 €/m² | - |
| Statistiques Grumesnil | 459 | 11 km² | 42 h/km² | 46.2% | 5% | 20 050 €/an | 1 158 €/m² | 0.8 |
| Statistiques Lannoy-Cuillère | 284 | 15 km² | 19 h/km² | 46.5% | 6% | 21 340 €/an | 2 077 €/m² | 4.0 |
| Statistiques Canny-sur-Thérain | 223 | 6 km² | 37 h/km² | 54.7% | 4.5% | 21 700 €/an | 1 789 €/m² | - |
| Statistiques Abancourt | 594 | 6 km² | 99 h/km² | 45.3% | 9.3% | 20 360 €/an | 1 081 €/m² | 1.4 |
| Statistiques Saint-Samson-la-Poterie | 238 | 4 km² | 60 h/km² | 47.5% | 6.3% | 22 350 €/an | 1 070 €/m² | 1.8 |
| Statistiques Moliens | 1 135 | 9 km² | 126 h/km² | 48.8% | 7% | 20 090 €/an | 1 342 €/m² | 3.6 |
| Statistiques Saint-Arnoult | 200 | 8 km² | 25 h/km² | 36% | 2% | 22 550 €/an | 2 088 €/m² | - |
| Statistiques Saint-Michel-d'Halescourt | 116 | 5 km² | 23 h/km² | 44.8% | 3.4% | 20 850 €/an | 1 129 €/m² | - |