


Signalement de photo
Merci ! Votre signalement est envoyé !
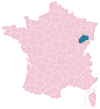
Quel est le nombre d'habitants à Bougey ? Dans quel département et dans quelle région se situe la ville ? Quelle est sa superficie ?
Quels sont les chiffres de la délinquance ?
Découvrez sur cette page toutes les informations essentielles sur la population, la sécurité, les services et l'immobilier à Bougey.
NOUVEAU : Rues sales, dépôts sauvages, dégradations urbaines. Faites votre signalement anonyme, nous nous chargeons de prévenir les autorités compétentes.
| Nombre d'habitants | 94 | Classement |
| Age moyen | 42 ans | Classement |
| Pop active | 39.4% | Classement |
| Taux chômage | 1.1% | Classement |
| Pop densité | 10 h/km² | Classement |
| Revenu moyen | NC | Classement |
| Agressions physiques / sexuelles | 0 |
| Cambriolages | 0 |
| Vols / dégradations | 0 |
| Stupéfiants | 0 |
Achat / Vente / Location Votre agence immobilière à Bougey
| Prix moyen | 88 216 € | Prix moyen au m² | 910 € |
Carte de la ville de Bougey

Commerce |
|
|---|---|
|
Hypermarché (25km) Pusey |
|
|
Supermarché (4km) Jussey |
|
|
Boulangerie (4km) Jussey |
|
|
Boucherie (4km) Jussey |
|
|
Station-service (4km) Jussey |
|
|
Banque (4km) Jussey |
|
|
La poste (4km) Jussey |
|
|
Coiffeur (4km) Jussey |
|
|
Vétérinaire (4km) Jussey |
|
|
Restaurant (4km) Jussey |
|
Éducation |
|
|---|---|
|
Maternelle (4km) Jussey |
|
|
Primaire (4km) Jussey |
|
|
Collège (4km) Jussey |
|
|
Lycée (20km) Fayl-Billot |
|


NOUVEAU : Décharges sauvages, détritus, objets abandonnés, graffitis, nids-de-poule : Déclarer un incident à Bougey


 Marine LE PEN
 Emmanuel MACRON
 Jean LASSALLE
 Jean-Luc MÉLENCHON
 Valérie PÉCRESSE
 Éric ZEMMOUR
 Nicolas DUPONT-AIGNAN
 Anne HIDALGO
 Nathalie ARTHAUD
 Fabien ROUSSEL
 Yannick JADOT
 Philippe POUTOUEmmanuel MACRONMarine LE PEN
| Ville | Habitants | Superficie | Pop densité | Pop active | Taux chômage | Revenu moyen | Prix immobilier | Note globale |
|---|---|---|---|---|---|---|---|---|
| Statistiques Oigney | 34 | 8 km² | 4 h/km² | 17.6% | 2.9% | NC | NC | - |
| Statistiques Augicourt | 173 | 9 km² | 19 h/km² | 39.9% | 6.9% | 19 970 €/an | 1 033 €/m² | - |
| Statistiques Montigny-lès-Cherlieu | 124 | 21 km² | 6 h/km² | 30.6% | 4.8% | 21 060 €/an | 921 €/m² | - |
| Statistiques Jussey | 1 542 | 34 km² | 45 h/km² | 35.7% | 6.2% | 19 270 €/an | 1 039 €/m² | - |
| Statistiques Lambrey | 71 | 6 km² | 12 h/km² | 50.7% | 4.2% | NC | NC | - |
| Statistiques Gevigney-et-Mercey | 503 | 19 km² | 26 h/km² | 48.1% | 3% | 21 590 €/an | 1 010 €/m² | 4.2 |
| Statistiques Semmadon | 110 | 11 km² | 10 h/km² | 40% | 7.3% | NC | NC | - |
| Statistiques Cemboing | 170 | 11 km² | 15 h/km² | 39.4% | 1.8% | 21 570 €/an | NC | - |
| Statistiques Saint-Marcel | 89 | 7 km² | 13 h/km² | 48.3% | 2.2% | NC | NC | - |
| Statistiques Melin | 58 | 6 km² | 10 h/km² | 34.5% | 5.2% | NC | NC | - |
| Statistiques Preigney | 114 | 12 km² | 10 h/km² | 36% | 3.5% | 19 120 €/an | NC | - |
| Statistiques Rosières-sur-Mance | 52 | 5 km² | 10 h/km² | 32.7% | 5.8% | NC | NC | - |
| Statistiques Arbecey | 241 | 17 km² | 14 h/km² | 45.2% | 5.8% | 20 580 €/an | 747 €/m² | - |
| Statistiques Combeaufontaine | 539 | 12 km² | 45 h/km² | 46.8% | 4.5% | 20 980 €/an | 734 €/m² | 1.8 |
| Statistiques Gourgeon | 175 | 14 km² | 13 h/km² | 54.3% | 5.7% | 23 030 €/an | NC | - |