


Signalement de photo
Merci ! Votre signalement est envoyé !
Quel est le nombre d'habitants à Boismorand ? Dans quel département et dans quelle région se situe la ville ? Quelle est sa superficie ?
Quels sont les chiffres de la délinquance ?
Découvrez sur cette page toutes les informations essentielles sur la population, la sécurité, les services et l'immobilier à Boismorand.
NOUVEAU : Rues sales, dépôts sauvages, dégradations urbaines. Faites votre signalement anonyme, nous nous chargeons de prévenir les autorités compétentes.
| Nombre d'habitants | 847 | Classement |
| Age moyen | 43 ans | Classement |
| Pop active | 44% | Classement |
| Taux chômage | 2.7% | Classement |
| Pop densité | 34 h/km² | Classement |
| Revenu moyen | 25 380 €/an | Classement |
| Agressions physiques / sexuelles | 0 |
| Cambriolages | 0 |
| Vols / dégradations | 0 |
| Stupéfiants | 0 |
Achat / Vente / Location Votre agence immobilière à Boismorand
| Prix moyen | 64 008 € | Prix moyen au m² | 645 € |
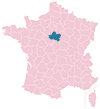
Carte de la ville de Boismorand

Commerce |
|
|---|---|
|
Hypermarché (11km) Gien |
|
|
Supermarché (7km) Inzinzac-Lochrist |
|
|
Boulangerie (3km) Les Choux |
|
|
Boucherie (7km) Inzinzac-Lochrist |
|
|
Station-service (7km) Inzinzac-Lochrist |
|
|
Banque (7km) Inzinzac-Lochrist |
|
|
La poste (7km) Inzinzac-Lochrist |
|
|
Coiffeur (5km) La Bussière |
|
|
Vétérinaire (8km) Nogent-sur-Vernisson |
|
| Restaurant | 4 |
Santé |
|
|---|---|
|
Médecin (5km) La Bussière |
|
|
Dentiste (7km) Inzinzac-Lochrist |
|
|
Pharmacie (7km) Inzinzac-Lochrist |
|
Éducation |
|
|---|---|
| Maternelle | 1 |
| Primaire | 1 |
|
Collège (8km) Sainte-Geneviève-des-Bois |
|
|
Lycée (11km) Gien |
|


NOUVEAU : Décharges sauvages, détritus, objets abandonnés, graffitis, nids-de-poule : Déclarer un incident à Boismorand


 Marine LE PEN
 Emmanuel MACRON
 Jean-Luc MÉLENCHON
 Éric ZEMMOUR
 Yannick JADOT
 Valérie PÉCRESSE
 Nicolas DUPONT-AIGNAN
 Jean LASSALLE
 Anne HIDALGO
 Fabien ROUSSEL
 Philippe POUTOU
 Nathalie ARTHAUDEmmanuel MACRONMarine LE PEN
| Ville | Habitants | Superficie | Pop densité | Pop active | Taux chômage | Revenu moyen | Prix immobilier | Note globale |
|---|---|---|---|---|---|---|---|---|
| Statistiques Les Choux | 530 | 33 km² | 16 h/km² | 49.6% | 4.9% | 23 820 €/an | 1 300 €/m² | - |
| Statistiques La Bussière | 771 | 35 km² | 22 h/km² | 47.1% | 5.8% | 23 010 €/an | 1 446 €/m² | - |
| Statistiques Langesse | 82 | 9 km² | 9 h/km² | 41.5% | 3.7% | NC | 807 €/m² | - |
| Statistiques Adon | 195 | 25 km² | 8 h/km² | 47.2% | 7.2% | 22 920 €/an | 1 381 €/m² | - |
| Statistiques Inzinzac-Lochrist | 6 571 | 45 km² | 146 h/km² | 45% | 4.8% | 22 680 €/an | 1 624 €/m² | 3.9 |
| Statistiques Nogent-sur-Vernisson | 2 569 | 33 km² | 78 h/km² | 40.4% | 6.9% | 21 620 €/an | 1 332 €/m² | - |
| Statistiques Sainte-Geneviève-des-Bois | 1 057 | 41 km² | 26 h/km² | 42.8% | 6.8% | 20 610 €/an | 1 172 €/m² | 3.8 |
| Statistiques Le Moulinet-sur-Solin | 120 | 19 km² | 6 h/km² | 45% | 1.7% | 26 580 €/an | 1 052 €/m² | - |
| Statistiques Plouhinec | 5 354 | 36 km² | 149 h/km² | 40.5% | 3.5% | 24 450 €/an | 2 453 €/m² | 3.5 |
| Statistiques Varennes-Changy | 1 484 | 30 km² | 49 h/km² | 46.1% | 4.7% | 23 220 €/an | 1 401 €/m² | 3.8 |
| Statistiques Escrignelles | 50 | 14 km² | 4 h/km² | 46% | 2% | NC | 1 570 €/m² | - |
| Statistiques Pont-Scorff | 3 965 | 24 km² | 165 h/km² | 47.1% | 4% | 23 570 €/an | 1 927 €/m² | 2.2 |
| Statistiques Feins-en-Gâtinais | 32 | 12 km² | 3 h/km² | 43.8% | 6.3% | NC | 1 131 €/m² | - |
| Statistiques Cléguer | 3 348 | 32 km² | 105 h/km² | 44.6% | 4% | 23 140 €/an | 1 578 €/m² | 3.7 |
| Statistiques Gien | 13 387 | 68 km² | 197 h/km² | 39.9% | 6.9% | 19 830 €/an | 1 143 €/m² | 3.2 |