


Signalement de photo
Merci ! Votre signalement est envoyé !
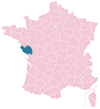
Quel est le nombre d'habitants à Bellevigny ? Dans quel département et dans quelle région se situe la ville ? Quelle est sa superficie ?
Quels sont les chiffres de la délinquance ?
Découvrez sur cette page toutes les informations essentielles sur la population, la sécurité, les services et l'immobilier à Bellevigny.
NOUVEAU : Rues sales, dépôts sauvages, dégradations urbaines. Faites votre signalement anonyme, nous nous chargeons de prévenir les autorités compétentes.
| Nombre d'habitants | 6 235 | Classement |
| Age moyen | 39 ans | Classement |
| Pop active | 50.8% | Classement |
| Taux chômage | 3.5% | Classement |
| Pop densité | 160 h/km² | Classement |
| Revenu moyen | 23 800 €/an | Classement |
| Agressions physiques / sexuelles | 14 |
| Cambriolages | 0 |
| Vols / dégradations | 63 |
| Stupéfiants | 0 |
Achat / Vente / Location Votre agence immobilière à Bellevigny
| Prix moyen | 169 020 € | Prix moyen au m² | 1 711 € |
| Prix moyen | 34 497 € | Prix moyen au m² | 986 € |
Carte de la ville de Bellevigny

Commerce |
|
|---|---|
| Hypermarché | 1 |
|
Supermarché (7km) Le Poiré-sur-Vie |
|
| Boulangerie | 5 |
| Boucherie | 1 |
| Station-service | 2 |
| Banque | 3 |
| La poste | 1 |
| Coiffeur | 6 |
| Vétérinaire | 1 |
| Restaurant | 7 |
Santé |
|
|---|---|
| Médecin | 2 |
| Dentiste | 12 |
| Pharmacie | 1 |
Éducation |
|
|---|---|
| Maternelle | 4 |
| Primaire | 4 |
| Collège | 1 |
|
Lycée (13km) La Roche-sur-Yon |
|

NOUVEAU : Décharges sauvages, détritus, objets abandonnés, graffitis, nids-de-poule : Déclarer un incident à Bellevigny


 Emmanuel MACRON
 Marine LE PEN
 Jean-Luc MÉLENCHON
 Yannick JADOT
 Éric ZEMMOUR
 Valérie PÉCRESSE
 Fabien ROUSSEL
 Jean LASSALLE
 Anne HIDALGO
 Nicolas DUPONT-AIGNAN
 Philippe POUTOU
 Nathalie ARTHAUDEmmanuel MACRONMarine LE PEN
| Ville | Habitants | Superficie | Pop densité | Pop active | Taux chômage | Revenu moyen | Prix immobilier | Note globale |
|---|---|---|---|---|---|---|---|---|
| Statistiques Le Poiré-sur-Vie | 8 626 | 72 km² | 120 h/km² | 49.4% | 2.5% | 23 470 €/an | 1 736 €/m² | 3.4 |
| Statistiques Saint-Denis-la-Chevasse | 2 409 | 39 km² | 62 h/km² | 50% | 2.2% | 22 810 €/an | 1 549 €/m² | - |
| Statistiques Dompierre-sur-Yon | 4 457 | 34 km² | 131 h/km² | 49.8% | 2.5% | 24 310 €/an | 1 660 €/m² | 4.1 |
| Statistiques Mouilleron-le-Captif | 5 037 | 20 km² | 252 h/km² | 45.4% | 2.6% | 25 480 €/an | 2 047 €/m² | 3.9 |
| Statistiques Les Lucs-sur-Boulogne | 3 642 | 53 km² | 69 h/km² | 48.3% | 3% | 22 740 €/an | 1 405 €/m² | 3.4 |
| Statistiques La Genétouze | 1 976 | 13 km² | 152 h/km² | 50.8% | 3.1% | 23 810 €/an | 1 807 €/m² | 3.7 |
| Statistiques La Copechagnière | 1 048 | 10 km² | 105 h/km² | 53.5% | 3.5% | 22 360 €/an | 1 437 €/m² | 2.8 |
| Statistiques La Merlatière | 1 011 | 15 km² | 67 h/km² | 53.7% | 2.8% | 22 560 €/an | 1 670 €/m² | 4.6 |
| Statistiques La Ferrière | 5 398 | 47 km² | 115 h/km² | 47.3% | 3.4% | 23 570 €/an | 1 660 €/m² | 4.2 |
| Statistiques Venansault | 4 720 | 44 km² | 107 h/km² | 47.6% | 2.8% | 23 820 €/an | 1 715 €/m² | 4.0 |
| Statistiques La Roche-sur-Yon | 54 952 | 88 km² | 624 h/km² | 45.2% | 6.3% | 22 310 €/an | 1 820 €/m² | 3.5 |
| Statistiques Chauché | 2 506 | 42 km² | 60 h/km² | 49.9% | 2.1% | 23 180 €/an | 1 456 €/m² | 2.6 |
| Statistiques Saint-Étienne-du-Bois | 2 191 | 29 km² | 76 h/km² | 45.7% | 5.6% | 21 360 €/an | 1 386 €/m² | 2.0 |
| Statistiques La Chapelle-Palluau | 1 050 | 13 km² | 81 h/km² | 48.5% | 2.8% | 22 280 €/an | 1 641 €/m² | 3.8 |
| Statistiques Les Brouzils | 2 914 | 41 km² | 71 h/km² | 50.8% | 2.7% | 23 210 €/an | 1 473 €/m² | 3.4 |