


Signalement de photo
Merci ! Votre signalement est envoyé !
Quel est le nombre d'habitants à Barbentane ? Dans quel département et dans quelle région se situe la ville ? Quelle est sa superficie ?
Quels sont les chiffres de la délinquance ?
Découvrez sur cette page toutes les informations essentielles sur la population, la sécurité, les services et l'immobilier à Barbentane.
NOUVEAU : Rues sales, dépôts sauvages, dégradations urbaines. Faites votre signalement anonyme, nous nous chargeons de prévenir les autorités compétentes.
| Nombre d'habitants | 4 236 | Classement |
| Age moyen | 45 ans | Classement |
| Pop active | 45.6% | Classement |
| Taux chômage | 5.1% | Classement |
| Pop densité | 157 h/km² | Classement |
| Revenu moyen | 24 120 €/an | Classement |
| Agressions physiques / sexuelles | 12 |
| Cambriolages | 18 |
| Vols / dégradations | 54 |
| Stupéfiants | 19 |
Achat / Vente / Location Votre agence immobilière à Barbentane
| Prix moyen | 260 879 € | Prix moyen au m² | 2 664 € |
| Prix moyen | 159 073 € | Prix moyen au m² | 2 857 € |
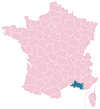
Carte de la ville de Barbentane

Commerce |
|
|---|---|
|
Hypermarché (6km) Les Angles |
|
| Supermarché | 1 |
| Boulangerie | 3 |
|
Boucherie (6km) Aramon |
|
| Station-service | 1 |
| Banque | 2 |
| La poste | 1 |
| Coiffeur | 10 |
| Vétérinaire | 2 |
| Restaurant | 9 |
Santé |
|
|---|---|
| Médecin | 2 |
| Dentiste | 1 |
| Pharmacie | 1 |


NOUVEAU : Décharges sauvages, détritus, objets abandonnés, graffitis, nids-de-poule : Déclarer un incident à Barbentane


 Marine LE PEN
 Emmanuel MACRON
 Jean-Luc MÉLENCHON
 Éric ZEMMOUR
 Valérie PÉCRESSE
 Yannick JADOT
 Jean LASSALLE
 Nicolas DUPONT-AIGNAN
 Fabien ROUSSEL
 Anne HIDALGO
 Philippe POUTOU
 Nathalie ARTHAUDEmmanuel MACRONMarine LE PEN
| Ville | Habitants | Superficie | Pop densité | Pop active | Taux chômage | Revenu moyen | Prix immobilier | Note globale |
|---|---|---|---|---|---|---|---|---|
| Statistiques Rognonas | 4 111 | 9 km² | 457 h/km² | 43.8% | 5% | 23 980 €/an | 2 899 €/m² | 4.4 |
| Statistiques Aramon | 4 127 | 31 km² | 133 h/km² | 45.1% | 5.3% | 22 560 €/an | 2 244 €/m² | - |
| Statistiques Graveson | 4 791 | 24 km² | 200 h/km² | 50.1% | 4.6% | 23 070 €/an | 2 730 €/m² | 3.4 |
| Statistiques Les Angles | 8 480 | 18 km² | 471 h/km² | 42.7% | 5.1% | 25 410 €/an | 2 719 €/m² | 4.3 |
| Statistiques Saze | 2 104 | 13 km² | 162 h/km² | 48.7% | 5.2% | 24 560 €/an | 2 476 €/m² | - |
| Statistiques Boulbon | 1 519 | 19 km² | 80 h/km² | 45.3% | 5.5% | 24 490 €/an | 2 600 €/m² | 3.2 |
| Statistiques Avignon | 90 330 | 65 km² | 1 390 h/km² | 42.1% | 9.7% | 17 690 €/an | 2 127 €/m² | 2.4 |
| Statistiques Maillane | 2 738 | 17 km² | 161 h/km² | 48.3% | 4.6% | 24 450 €/an | 2 642 €/m² | 4.4 |
| Statistiques Châteaurenard | 16 669 | 35 km² | 476 h/km² | 46.1% | 6.2% | 21 440 €/an | 2 612 €/m² | 3.9 |
| Statistiques Villeneuve-lès-Avignon | 12 617 | 18 km² | 701 h/km² | 42.4% | 4.2% | 27 590 €/an | 3 032 €/m² | 3.9 |
| Statistiques Domazan | 956 | 11 km² | 87 h/km² | 49.2% | 4.6% | 24 310 €/an | 2 627 €/m² | - |
| Statistiques Rochefort-du-Gard | 7 921 | 34 km² | 233 h/km² | 47.8% | 4.4% | 25 350 €/an | 2 626 €/m² | 2.9 |
| Statistiques Saint-Pierre-de-Mézoargues | 223 | 4 km² | 56 h/km² | 48% | 4.5% | 22 850 €/an | 2 312 €/m² | - |
| Statistiques Eyragues | 4 355 | 21 km² | 207 h/km² | 46.7% | 4% | 23 990 €/an | 2 850 €/m² | 3.8 |
| Statistiques Théziers | 1 053 | 11 km² | 96 h/km² | 48.7% | 7.1% | 22 350 €/an | 1 615 €/m² | 3.0 |