


Signalement de photo
Merci ! Votre signalement est envoyé !
Quel est le nombre d'habitants à Balzac ? Dans quel département et dans quelle région se situe la ville ? Quelle est sa superficie ?
Quels sont les chiffres de la délinquance ?
Découvrez sur cette page toutes les informations essentielles sur la population, la sécurité, les services et l'immobilier à Balzac.
NOUVEAU : Rues sales, dépôts sauvages, dégradations urbaines. Faites votre signalement anonyme, nous nous chargeons de prévenir les autorités compétentes.
| Nombre d'habitants | 1 378 | Classement |
| Age moyen | 44 ans | Classement |
| Pop active | 46.1% | Classement |
| Taux chômage | 3.9% | Classement |
| Pop densité | 138 h/km² | Classement |
| Revenu moyen | 25 860 €/an | Classement |
| Agressions physiques / sexuelles | 0 |
| Cambriolages | 0 |
| Vols / dégradations | 0 |
| Stupéfiants | 0 |
Achat / Vente / Location Votre agence immobilière à Balzac
| Prix moyen | 122 024 € | Prix moyen au m² | 1 183 € |
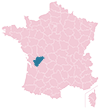
Carte de la ville de Balzac

Commerce |
|
|---|---|
|
Hypermarché (7km) Champniers |
|
|
Supermarché (2km) Saint-Yrieix-sur-Charente |
|
| Boulangerie | 1 |
|
Boucherie (2km) Saint-Yrieix-sur-Charente |
|
|
Station-service (2km) Saint-Yrieix-sur-Charente |
|
|
Banque (5km) Gond-Pontouvre |
|
|
La poste (2km) Saint-Yrieix-sur-Charente |
|
| Coiffeur | 1 |
|
Vétérinaire (2km) Saint-Yrieix-sur-Charente |
|
| Restaurant | 1 |
Santé |
|
|---|---|
| Médecin | 1 |
|
Dentiste (2km) Saint-Yrieix-sur-Charente |
|
| Pharmacie | 1 |
Éducation |
|
|---|---|
| Maternelle | 1 |
| Primaire | 1 |
|
Collège (5km) Gond-Pontouvre |
|
|
Lycée (2km) Saint-Yrieix-sur-Charente |
|


NOUVEAU : Décharges sauvages, détritus, objets abandonnés, graffitis, nids-de-poule : Déclarer un incident à Balzac


 Emmanuel MACRON
 Marine LE PEN
 Jean-Luc MÉLENCHON
 Éric ZEMMOUR
 Jean LASSALLE
 Valérie PÉCRESSE
 Fabien ROUSSEL
 Yannick JADOT
 Anne HIDALGO
 Nicolas DUPONT-AIGNAN
 Philippe POUTOU
 Nathalie ARTHAUDEmmanuel MACRONMarine LE PEN
| Ville | Habitants | Superficie | Pop densité | Pop active | Taux chômage | Revenu moyen | Prix immobilier | Note globale |
|---|---|---|---|---|---|---|---|---|
| Statistiques Saint-Yrieix-sur-Charente | 7 525 | 15 km² | 502 h/km² | 44.4% | 5% | 24 140 €/an | 1 573 €/m² | - |
| Statistiques Vindelle | 1 062 | 11 km² | 97 h/km² | 46.6% | 2.8% | 24 140 €/an | 1 374 €/m² | - |
| Statistiques Fléac | 3 842 | 13 km² | 296 h/km² | 46.9% | 4.7% | 23 980 €/an | 1 456 €/m² | 4.3 |
| Statistiques Marsac | 790 | 13 km² | 61 h/km² | 47.5% | 5.1% | 23 730 €/an | 1 153 €/m² | - |
| Statistiques Gond-Pontouvre | 5 950 | 7 km² | 850 h/km² | 47.9% | 5.3% | 21 880 €/an | 1 344 €/m² | 2.9 |
| Statistiques Asnières-sur-Nouère | 1 283 | 21 km² | 61 h/km² | 48.5% | 4.4% | 23 840 €/an | 1 263 €/m² | 4.2 |
| Statistiques Saint-Michel | 3 224 | 2 km² | 1 612 h/km² | 42.4% | 6% | 21 170 €/an | 1 269 €/m² | - |
| Statistiques Angoulême | 41 086 | 22 km² | 1 868 h/km² | 47.3% | 10% | 19 830 €/an | 1 433 €/m² | 3.3 |
| Statistiques Linars | 2 096 | 6 km² | 349 h/km² | 40.6% | 4.5% | 23 800 €/an | 1 402 €/m² | 2.0 |
| Statistiques Saint-Saturnin | 1 281 | 13 km² | 99 h/km² | 48.5% | 3.2% | 25 460 €/an | 2 547 €/m² | - |
| Statistiques Champniers | 5 193 | 45 km² | 115 h/km² | 46.6% | 4.1% | 25 410 €/an | 1 513 €/m² | 3.5 |
| Statistiques Vars | 2 165 | 27 km² | 80 h/km² | 49.1% | 3.2% | 23 400 €/an | 1 120 €/m² | - |
| Statistiques L'Isle-d'Espagnac | 5 662 | 6 km² | 944 h/km² | 42.8% | 4.5% | 22 380 €/an | 1 431 €/m² | 3.3 |
| Statistiques Saint-Genis-d'Hiersac | 906 | 19 km² | 48 h/km² | 49.4% | 4% | 23 130 €/an | 1 303 €/m² | - |
| Statistiques Soyaux | 9 995 | 13 km² | 769 h/km² | 38.8% | 8.9% | 18 730 €/an | 1 355 €/m² | 2.9 |