


Signalement de photo
Merci ! Votre signalement est envoyé !
Quel est le nombre d'habitants à Astaffort ? Dans quel département et dans quelle région se situe la ville ? Quelle est sa superficie ?
Quels sont les chiffres de la délinquance ?
Découvrez sur cette page toutes les informations essentielles sur la population, la sécurité, les services et l'immobilier à Astaffort.
NOUVEAU : Rues sales, dépôts sauvages, dégradations urbaines. Faites votre signalement anonyme, nous nous chargeons de prévenir les autorités compétentes.
| Nombre d'habitants | 2 031 | Classement |
| Age moyen | 46 ans | Classement |
| Pop active | 41.9% | Classement |
| Taux chômage | 5.2% | Classement |
| Pop densité | 58 h/km² | Classement |
| Revenu moyen | 20 820 €/an | Classement |
| Agressions physiques / sexuelles | 9 |
| Cambriolages | 0 |
| Vols / dégradations | 22 |
| Stupéfiants | 0 |
Achat / Vente / Location Votre agence immobilière à Astaffort
| Prix moyen | 113 341 € | Prix moyen au m² | 1 130 € |
| Prix moyen | 66 333 € | Prix moyen au m² | 998 € |
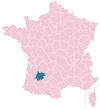
Carte de la ville de Astaffort

Commerce |
|
|---|---|
|
Hypermarché (11km) Boé |
|
| Supermarché | 1 |
| Boulangerie | 3 |
| Boucherie | 1 |
| Station-service | 1 |
| Banque | 1 |
| La poste | 1 |
| Coiffeur | 5 |
| Vétérinaire | 1 |
| Restaurant | 6 |
Santé |
|
|---|---|
| Médecin | 4 |
| Dentiste | 2 |
| Pharmacie | 1 |
Éducation |
|
|---|---|
| Maternelle | 2 |
| Primaire | 2 |
|
Collège (13km) Bon-Encontre |
|
|
Lycée (15km) Agen |
|


NOUVEAU : Décharges sauvages, détritus, objets abandonnés, graffitis, nids-de-poule : Déclarer un incident à Astaffort


 Marine LE PEN
 Emmanuel MACRON
 Jean-Luc MÉLENCHON
 Jean LASSALLE
 Éric ZEMMOUR
 Valérie PÉCRESSE
 Yannick JADOT
 Anne HIDALGO
 Nicolas DUPONT-AIGNAN
 Fabien ROUSSEL
 Philippe POUTOU
 Nathalie ARTHAUDEmmanuel MACRONMarine LE PEN
| Ville | Habitants | Superficie | Pop densité | Pop active | Taux chômage | Revenu moyen | Prix immobilier | Note globale |
|---|---|---|---|---|---|---|---|---|
| Statistiques Cuq | 279 | 17 km² | 16 h/km² | 43% | 5% | 23 350 €/an | 1 455 €/m² | - |
| Statistiques Fals | 404 | 9 km² | 45 h/km² | 51.7% | 4.5% | 26 160 €/an | 1 926 €/m² | - |
| Statistiques Saint-Mézard | 242 | 15 km² | 16 h/km² | 42.6% | 2.9% | 20 870 €/an | 1 168 €/m² | - |
| Statistiques Gimbrède | 276 | 25 km² | 11 h/km² | 48.2% | 5.1% | 20 630 €/an | 624 €/m² | 5.0 |
| Statistiques Pergain-Taillac | 335 | 19 km² | 18 h/km² | 44.5% | 5.4% | 22 000 €/an | 1 381 €/m² | - |
| Statistiques Sempesserre | 304 | 21 km² | 14 h/km² | 42.8% | 3.9% | 22 480 €/an | 2 087 €/m² | - |
| Statistiques Berrac | 113 | 8 km² | 14 h/km² | 37.2% | 2.7% | NC | 2 285 €/m² | - |
| Statistiques Layrac | 3 816 | 38 km² | 100 h/km² | 44.4% | 4.7% | 23 000 €/an | 1 444 €/m² | 3.4 |
| Statistiques Marmont-Pachas | 168 | 8 km² | 21 h/km² | 60.1% | 3.6% | 22 860 €/an | 2 317 €/m² | - |
| Statistiques Caudecoste | 1 132 | 17 km² | 67 h/km² | 49.6% | 5.5% | 22 250 €/an | 1 290 €/m² | - |
| Statistiques Sainte-Mère | 206 | 9 km² | 23 h/km² | 44.7% | 5.3% | 20 140 €/an | 316 €/m² | - |
| Statistiques Saint-Martin-de-Goyne | 123 | 6 km² | 21 h/km² | 42.3% | 2.4% | 22 800 €/an | 944 €/m² | - |
| Statistiques Sistels | 203 | 14 km² | 15 h/km² | 48.8% | 4.9% | 20 880 €/an | 2 300 €/m² | - |
| Statistiques Dunes | 1 210 | 23 km² | 53 h/km² | 48.5% | 5.4% | 23 020 €/an | 1 235 €/m² | 4.7 |
| Statistiques Saint-Avit-Frandat | 97 | 8 km² | 12 h/km² | 38.1% | 5.2% | NC | 1 800 €/m² | - |