


Signalement de photo
Merci ! Votre signalement est envoyé !
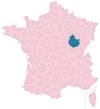
Quel est le nombre d'habitants à Ahuy ? Dans quel département et dans quelle région se situe la ville ? Quelle est sa superficie ?
Quels sont les chiffres de la délinquance ?
Découvrez sur cette page toutes les informations essentielles sur la population, la sécurité, les services et l'immobilier à Ahuy.
NOUVEAU : Rues sales, dépôts sauvages, dégradations urbaines. Faites votre signalement anonyme, nous nous chargeons de prévenir les autorités compétentes.
| Nombre d'habitants | 1 584 | Classement |
| Age moyen | 43 ans | Classement |
| Pop active | 45% | Classement |
| Taux chômage | 3.2% | Classement |
| Pop densité | 264 h/km² | Classement |
| Revenu moyen | 26 760 €/an | Classement |
| Agressions physiques / sexuelles | 14 |
| Cambriolages | 6 |
| Vols / dégradations | 27 |
| Stupéfiants | 0 |
Achat / Vente / Location Votre agence immobilière à Ahuy
| Prix moyen | 326 004 € | Prix moyen au m² | 2 736 € |
| Prix moyen | 184 558 € | Prix moyen au m² | 2 742 € |
Carte de la ville de Ahuy

Commerce |
|
|---|---|
|
Hypermarché (3km) Fontaine-lès-Dijon |
|
| Supermarché | 2 |
| Boulangerie | 1 |
|
Boucherie (2km) Asnières-lès-Dijon |
|
|
Station-service (3km) Fontaine-lès-Dijon |
|
|
Banque (3km) Fontaine-lès-Dijon |
|
|
La poste (3km) Fontaine-lès-Dijon |
|
| Coiffeur | 2 |
|
Vétérinaire (3km) Fontaine-lès-Dijon |
|
| Restaurant | 8 |
Santé |
|
|---|---|
| Médecin | 3 |
| Dentiste | 2 |
| Pharmacie | 1 |


NOUVEAU : Décharges sauvages, détritus, objets abandonnés, graffitis, nids-de-poule : Déclarer un incident à Ahuy


 Emmanuel MACRON
 Marine LE PEN
 Jean-Luc MÉLENCHON
 Éric ZEMMOUR
 Valérie PÉCRESSE
 Yannick JADOT
 Jean LASSALLE
 Nicolas DUPONT-AIGNAN
 Anne HIDALGO
 Fabien ROUSSEL
 Nathalie ARTHAUD
 Philippe POUTOUEmmanuel MACRONMarine LE PEN
| Ville | Habitants | Superficie | Pop densité | Pop active | Taux chômage | Revenu moyen | Prix immobilier | Note globale |
|---|---|---|---|---|---|---|---|---|
| Statistiques Asnières-lès-Dijon | 1 317 | 5 km² | 263 h/km² | 47.2% | 2.7% | 30 220 €/an | 3 352 €/m² | - |
| Statistiques Hauteville-lès-Dijon | 1 217 | 9 km² | 135 h/km² | 44.4% | 2.9% | 31 780 €/an | 1 733 €/m² | 3.5 |
| Statistiques Fontaine-lès-Dijon | 8 847 | 4 km² | 2 212 h/km² | 41.7% | 3.3% | 28 750 €/an | 2 387 €/m² | 4.2 |
| Statistiques Bellefond | 916 | 2 km² | 458 h/km² | 43.6% | 2.1% | 31 070 €/an | 2 676 €/m² | - |
| Statistiques Daix | 1 529 | 12 km² | 127 h/km² | 42.3% | 2.4% | 33 340 €/an | 4 246 €/m² | - |
| Statistiques Ruffey-lès-Echirey | 1 348 | 11 km² | 123 h/km² | 47.5% | 3% | 27 650 €/an | 1 580 €/m² | - |
| Statistiques Norges-la-Ville | 945 | 11 km² | 86 h/km² | 52.2% | 2.3% | 29 200 €/an | 2 102 €/m² | - |
| Statistiques Messigny-et-Vantoux | 1 699 | 34 km² | 50 h/km² | 41.6% | 2.6% | 31 400 €/an | 2 430 €/m² | - |
| Statistiques Saint-Apollinaire | 7 490 | 10 km² | 749 h/km² | 48.2% | 4% | 25 330 €/an | 2 470 €/m² | 4.5 |
| Statistiques Dijon | 159 346 | 40 km² | 3 984 h/km² | 47.1% | 6.7% | 22 720 €/an | 2 183 €/m² | 3.5 |
| Statistiques Talant | 11 894 | 5 km² | 2 379 h/km² | 40.2% | 5.5% | 23 800 €/an | 2 008 €/m² | 2.6 |
| Statistiques Bretigny | 903 | 7 km² | 129 h/km² | 51.3% | 3% | 31 560 €/an | 2 227 €/m² | 2.8 |
| Statistiques Plombières-lès-Dijon | 2 518 | 16 km² | 157 h/km² | 49.9% | 6.5% | 23 480 €/an | 1 940 €/m² | - |
| Statistiques Varois-et-Chaignot | 2 029 | 10 km² | 203 h/km² | 42.1% | 1.5% | 29 760 €/an | 2 726 €/m² | 2.4 |
| Statistiques Étaules | 359 | 17 km² | 21 h/km² | 43.5% | 3.3% | 30 430 €/an | 3 623 €/m² | - |