


Signalement de photo
Merci ! Votre signalement est envoyé !
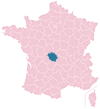
Quel est le nombre d'habitants à Ahun ? Dans quel département et dans quelle région se situe la ville ? Quelle est sa superficie ?
Quels sont les chiffres de la délinquance ?
Découvrez sur cette page toutes les informations essentielles sur la population, la sécurité, les services et l'immobilier à Ahun.
NOUVEAU : Rues sales, dépôts sauvages, dégradations urbaines. Faites votre signalement anonyme, nous nous chargeons de prévenir les autorités compétentes.
| Nombre d'habitants | 1 433 | Classement |
| Age moyen | 46 ans | Classement |
| Pop active | 42.6% | Classement |
| Taux chômage | 4.5% | Classement |
| Pop densité | 42 h/km² | Classement |
| Revenu moyen | 21 460 €/an | Classement |
| Agressions physiques / sexuelles | 10 |
| Cambriolages | 0 |
| Vols / dégradations | 8 |
| Stupéfiants | 0 |
Achat / Vente / Location Votre agence immobilière à Ahun
| Prix moyen | 42 664 € | Prix moyen au m² | 536 € |
| Prix moyen | 13 478 € | Prix moyen au m² | 407 € |
Carte de la ville de Ahun

Commerce |
|
|---|---|
|
Hypermarché (17km) Guéret |
|
| Supermarché | 1 |
| Boulangerie | 2 |
| Boucherie | 1 |
| Station-service | 1 |
| Banque | 2 |
| La poste | 1 |
| Coiffeur | 3 |
| Vétérinaire | 3 |
| Restaurant | 4 |
Santé |
|
|---|---|
| Médecin | 4 |
| Dentiste | 1 |
| Pharmacie | 1 |
Éducation |
|
|---|---|
| Maternelle | 1 |
| Primaire | 1 |
| Collège | 1 |
| Lycée | 1 |


NOUVEAU : Décharges sauvages, détritus, objets abandonnés, graffitis, nids-de-poule : Déclarer un incident à Ahun


 Marine LE PEN
 Emmanuel MACRON
 Jean-Luc MÉLENCHON
 Éric ZEMMOUR
 Valérie PÉCRESSE
 Jean LASSALLE
 Fabien ROUSSEL
 Anne HIDALGO
 Yannick JADOT
 Nicolas DUPONT-AIGNAN
 Philippe POUTOU
 Nathalie ARTHAUDEmmanuel MACRONMarine LE PEN
| Ville | Habitants | Superficie | Pop densité | Pop active | Taux chômage | Revenu moyen | Prix immobilier | Note globale |
|---|---|---|---|---|---|---|---|---|
| Statistiques Moutier-d'Ahun | 162 | 10 km² | 16 h/km² | 45.1% | 2.5% | 19 210 €/an | 513 €/m² | - |
| Statistiques Lavaveix-les-Mines | 639 | 5 km² | 128 h/km² | 34.6% | 8% | 17 870 €/an | 856 €/m² | 0.6 |
| Statistiques Chamberaud | 97 | 7 km² | 14 h/km² | 47.4% | 3.1% | 22 070 €/an | 744 €/m² | - |
| Statistiques Saint-Martial-le-Mont | 267 | 10 km² | 27 h/km² | 42.7% | 3.7% | 20 080 €/an | 910 €/m² | - |
| Statistiques Saint-Pardoux-les-Cards | 287 | 25 km² | 11 h/km² | 42.5% | 5.9% | 19 930 €/an | 787 €/m² | - |
| Statistiques Saint-Yrieix-les-Bois | 287 | 16 km² | 18 h/km² | 42.2% | 8% | 20 020 €/an | 759 €/m² | - |
| Statistiques Cressat | 516 | 33 km² | 16 h/km² | 44.2% | 5.2% | 21 240 €/an | 723 €/m² | 4.2 |
| Statistiques Sous-Parsat | 114 | 9 km² | 13 h/km² | 41.2% | 6.1% | 24 970 €/an | 916 €/m² | - |
| Statistiques Fransèches | 242 | 18 km² | 13 h/km² | 39.3% | 2.5% | 21 620 €/an | 1 564 €/m² | - |
| Statistiques Saint-Hilaire-la-Plaine | 213 | 11 km² | 19 h/km² | 45.1% | 3.8% | 21 420 €/an | 719 €/m² | - |
| Statistiques Saint-Sulpice-les-Champs | 345 | 22 km² | 16 h/km² | 44.3% | 5.2% | 20 540 €/an | 879 €/m² | - |
| Statistiques Issoudun-Létrieix | 294 | 26 km² | 11 h/km² | 44.2% | 3.4% | 19 390 €/an | 587 €/m² | - |
| Statistiques Le Donzeil | 187 | 14 km² | 13 h/km² | 41.7% | 5.3% | 18 450 €/an | 765 €/m² | - |
| Statistiques Saint-Médard-la-Rochette | 556 | 39 km² | 14 h/km² | 39% | 4.1% | 20 070 €/an | 1 050 €/m² | - |
| Statistiques Lépinas | 126 | 15 km² | 8 h/km² | 34.9% | 7.1% | 18 190 €/an | 1 045 €/m² | - |